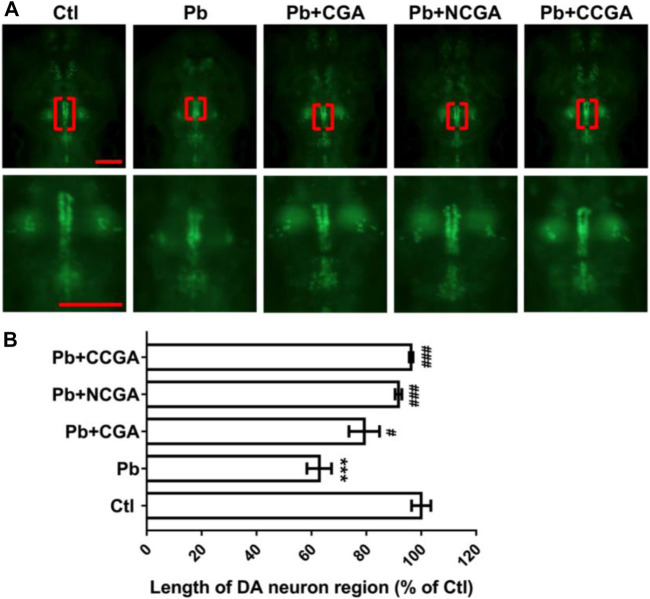
FIGURE 3.
Representative images of DA neuron of zebrafish and its analysis. (A) Representative fluorescence microscopy images of vmat2:GFP zebrafish at 120 hpf. DA neurons were indicated by the red brackets. Enlarged images are shown to improve visualization of DA neuron morphology (scale bar, 100 μm). (B) Statistical analysis of the length of the DA neuron region (n = 6); *** p < 0.001 vs. control and # p < 0.05, ### p < 0.001 vs. Pb.

