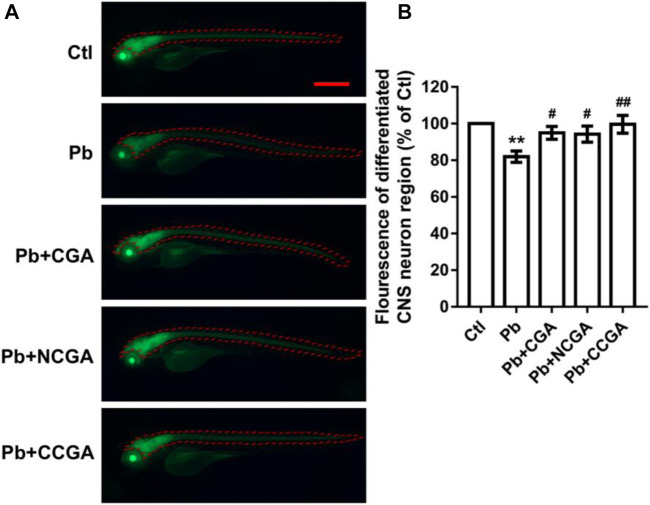
FIGURE 4.
Representative fluorescence images of differentiated CNS neuron region of zebrafish and its analysis. (A) Representative fluorescence microscopy images of elavl3:EGFP zebrafish at 120 hpf (scale bar, 500 μm). (B) Statistical analysis of the fluorescence of differentiated CNS neuron region (n = 6);** p < 0.01 vs. control and # p < 0.05, ## p < 0.01 vs. Pb.

