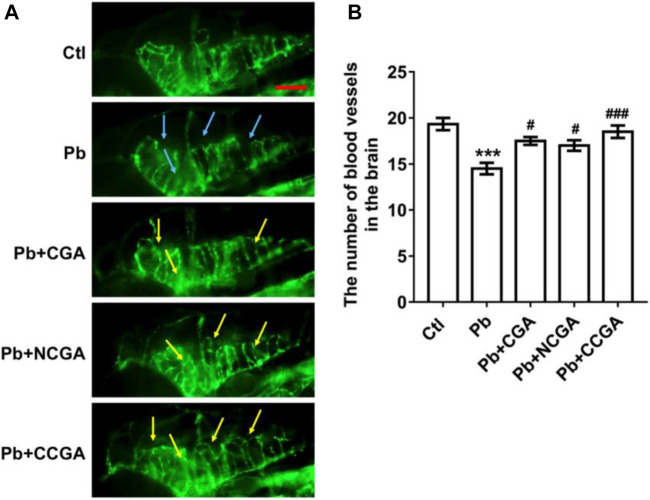
FIGURE 5.
Representative images of blood vasculature of zebrafish and its analysis. (A) Representative fluorescence microscopy images of fli1:GFP zebrafish at 120 hpf. Loss of vasculature was indicated by blue arrows. Recovery of vasculature was indicated by yellow arrows. (scale bar, 100 μm). (B) Statistical analysis of the number of blood vessels in the brain (n = 6). *** p < 0.001 vs. control and # p < 0.05, ### p < 0.001 vs. Pb.

