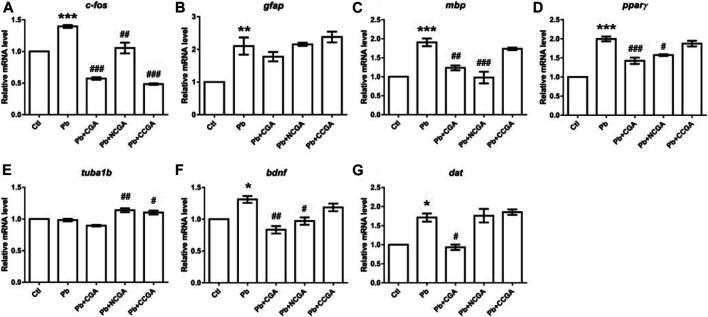
FIGURE 7.
Transcription of genes related to neurodevelopment. The graph plot is represented as fold changes in the mRNA expression of c-fos (A), gfap (B), mbp (C), pparγ (D), tuba1b (E), bdnf (F), and dat (G). Data were represented as mean ± SEM, n = 3, and statistically analyzed by one-way ANOVA followed by Dunnett’s multiple comparison test. * p < 0.05, ** p < 0.01, *** p < 0.001 vs. control and # p < 0.05, ## p < 0.01, ### p < 0.001 vs. Pb.

