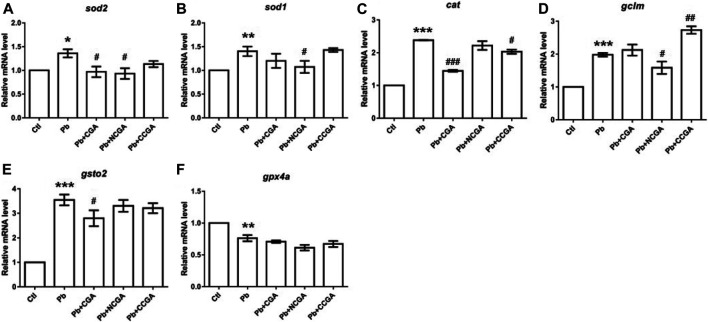
FIGURE 8.
Transcription of genes related to oxidative stress. The graph plot is represented as fold changes in the mRNA expression of sod2 (A), sod1 (B), cat (C), gclm (D), gsto2 (E), and gpx4a (F). Data were represented as mean ± SEM, n = 3, and statistically analyzed by one-way ANOVA followed by Dunnett’s multiple comparison test. * p < 0.05, ** p < 0.01, *** p < 0.001 vs. control and # p < 0.05, ## p < 0.01, ### p < 0.001 vs. Pb.

