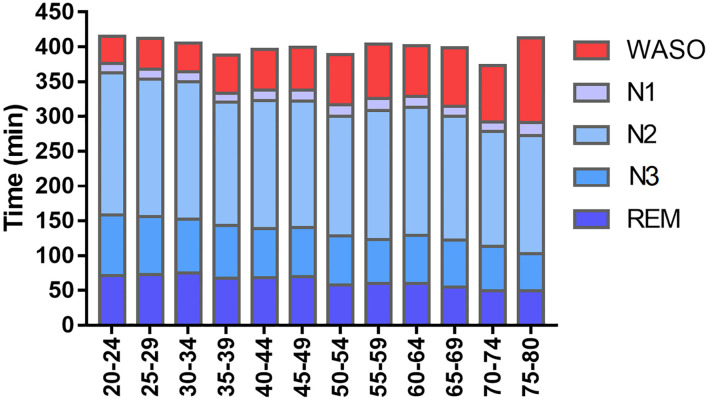
Figure 1.
Sleep structure throughout the lifespan. Values obtained in relation to prevalence obtained by the São Paulo Epidemiologic Sleep Study. Comparing the 20–24 to the 75–80 age strata, reductions in total sleep time (376–291 min), N3 sleep (87–53 min) and REM sleep duration (70–49 min), and an increase in time awake after sleep onset (WASO: 39–141 min) can be observed. A reduction in sleep efficiency (87–64%) and an increase in sleep latency (14–35 min) were also observed (data not shown). The reductions in N3 and REM sleep should be contextualized in respect of the global reduction in total sleep time. In terms of percentage, REM sleep proportion stays stable (18–17%) while slow-wave sleep is subjected to a small reduction (24–18%). Adapted from Moraes et al. (2014).

