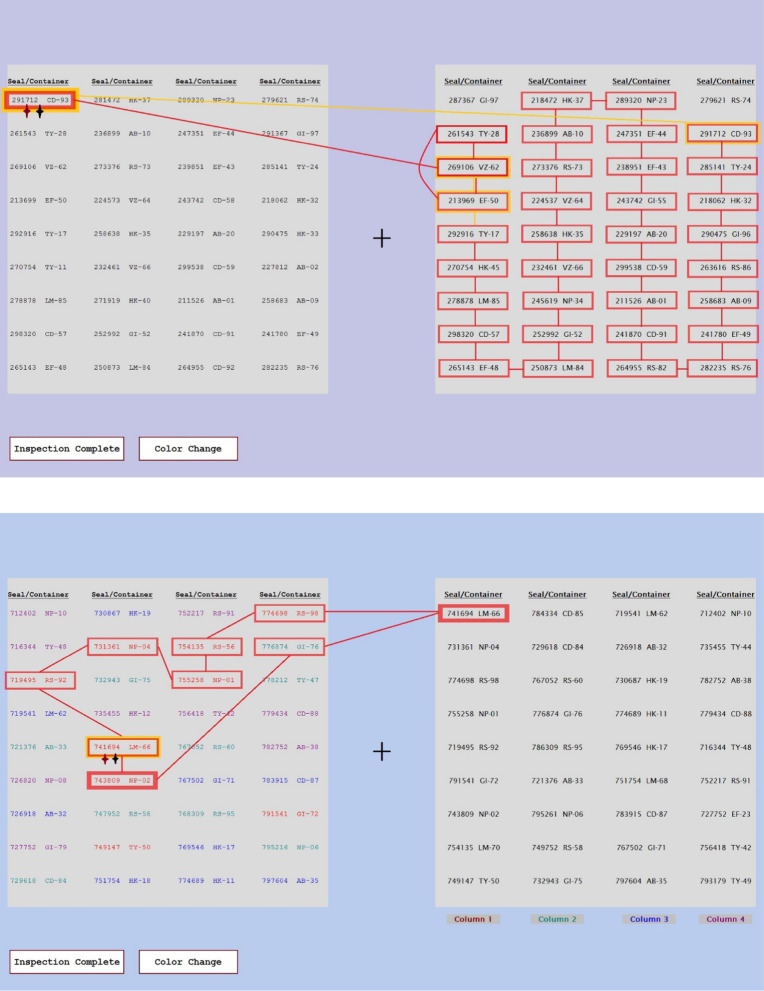
Fig. 9.
Examples of scanpaths obtained from the artificial foveation data. The top panel shows a trial from the Random Order, No Color condition and the bottom panel shows a trial from the Numerical Order, Color Coding condition. The first and last regions viewed are marked with red and black stars, respectively. The first visit to each region is indicated with a red box and the second visit is indicated with a yellow box. The box border is thicker when the dwell time in that region was more than 1 s

