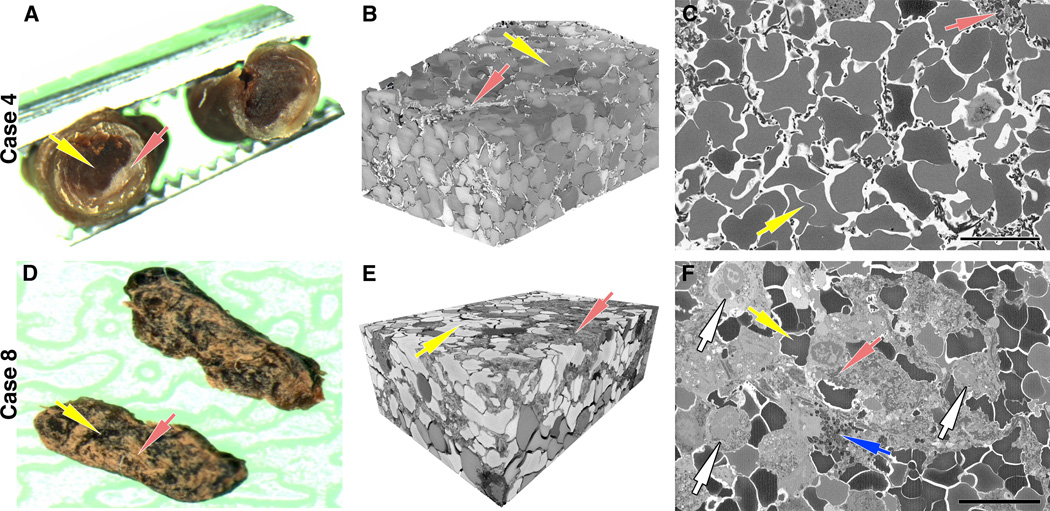
Figure 1. Serial block-face analysis of thrombi in two representative cases.
Clots were cut transversally (A) or longitudinally (D) in half with one piece processed for histopathological analysis and the other processed for serial block-face scanning electron microscopy (SBFSEM). (A) Gross examination of a transversally cut clot (Case 4) shows the presence of a red blood cell (RBC)-rich core (yellow arrow) and a fibrin/platelet-rich areas distributed mainly toward the periphery (red arrow). (B) Volume rendering of the RBC-rich core assembled from serial block-face imaging highlights the tightly packed arrays of polyhedral erythrocytes (polyhedrocytes, yellow arrow) intermixed with a limited volume of thin fibrin fibers (red arrow). (D) Gross examination of a longitudinally cut clot (Case 8) shows RBC-rich regions (yellow arrow) and fibrin/platelet-rich regions (red arrows) interspersed within the clot. (E) SBFSEM volume rendering highlights a region with mixed composition, consisting of both polyhedrocytes (yellow arrow) and dense network of fibrin fibers (red arrow). (C, F) A representative single 2D image from each volume used to generate the 3D rendering shows the different composition of each clot (yellow arrows=RBC, red arrows=fibrin). Note the presence of numerous white blood cells (white arrows) and granules likely released by platelets (blue arrow) within a densely packed fibrin network. Scale bar = 10 μm.

