
Figure 1.
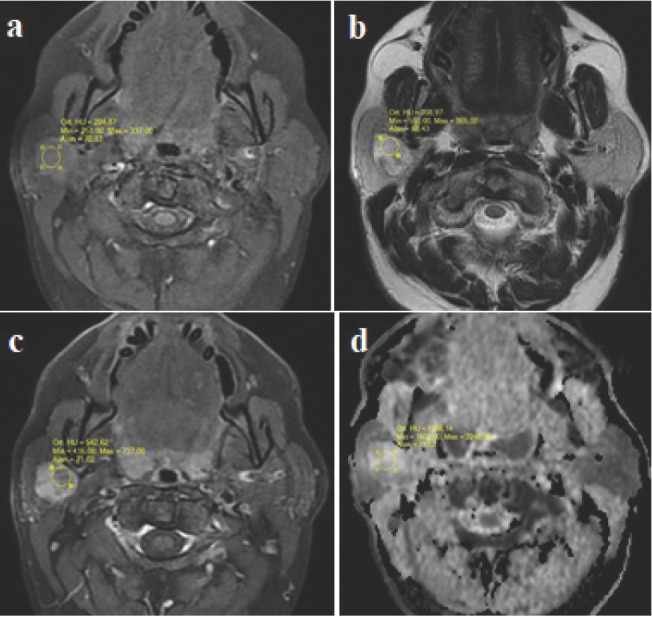
Signal intensity and ADC value measurements of a pleomorfic adenoma (ROIs) 1a: T1W axial image. A slightly hyperintense lesion in the superficial lobe of the right parotid gland 1b: T2W axial image. The lesion is hyperintense with hypointense nodular areas1c: T1W fat-saturated image with contrast, heterogenous enhancement of the lesion 1d: In the ADC map, high ADC values with no restricted diffusion.