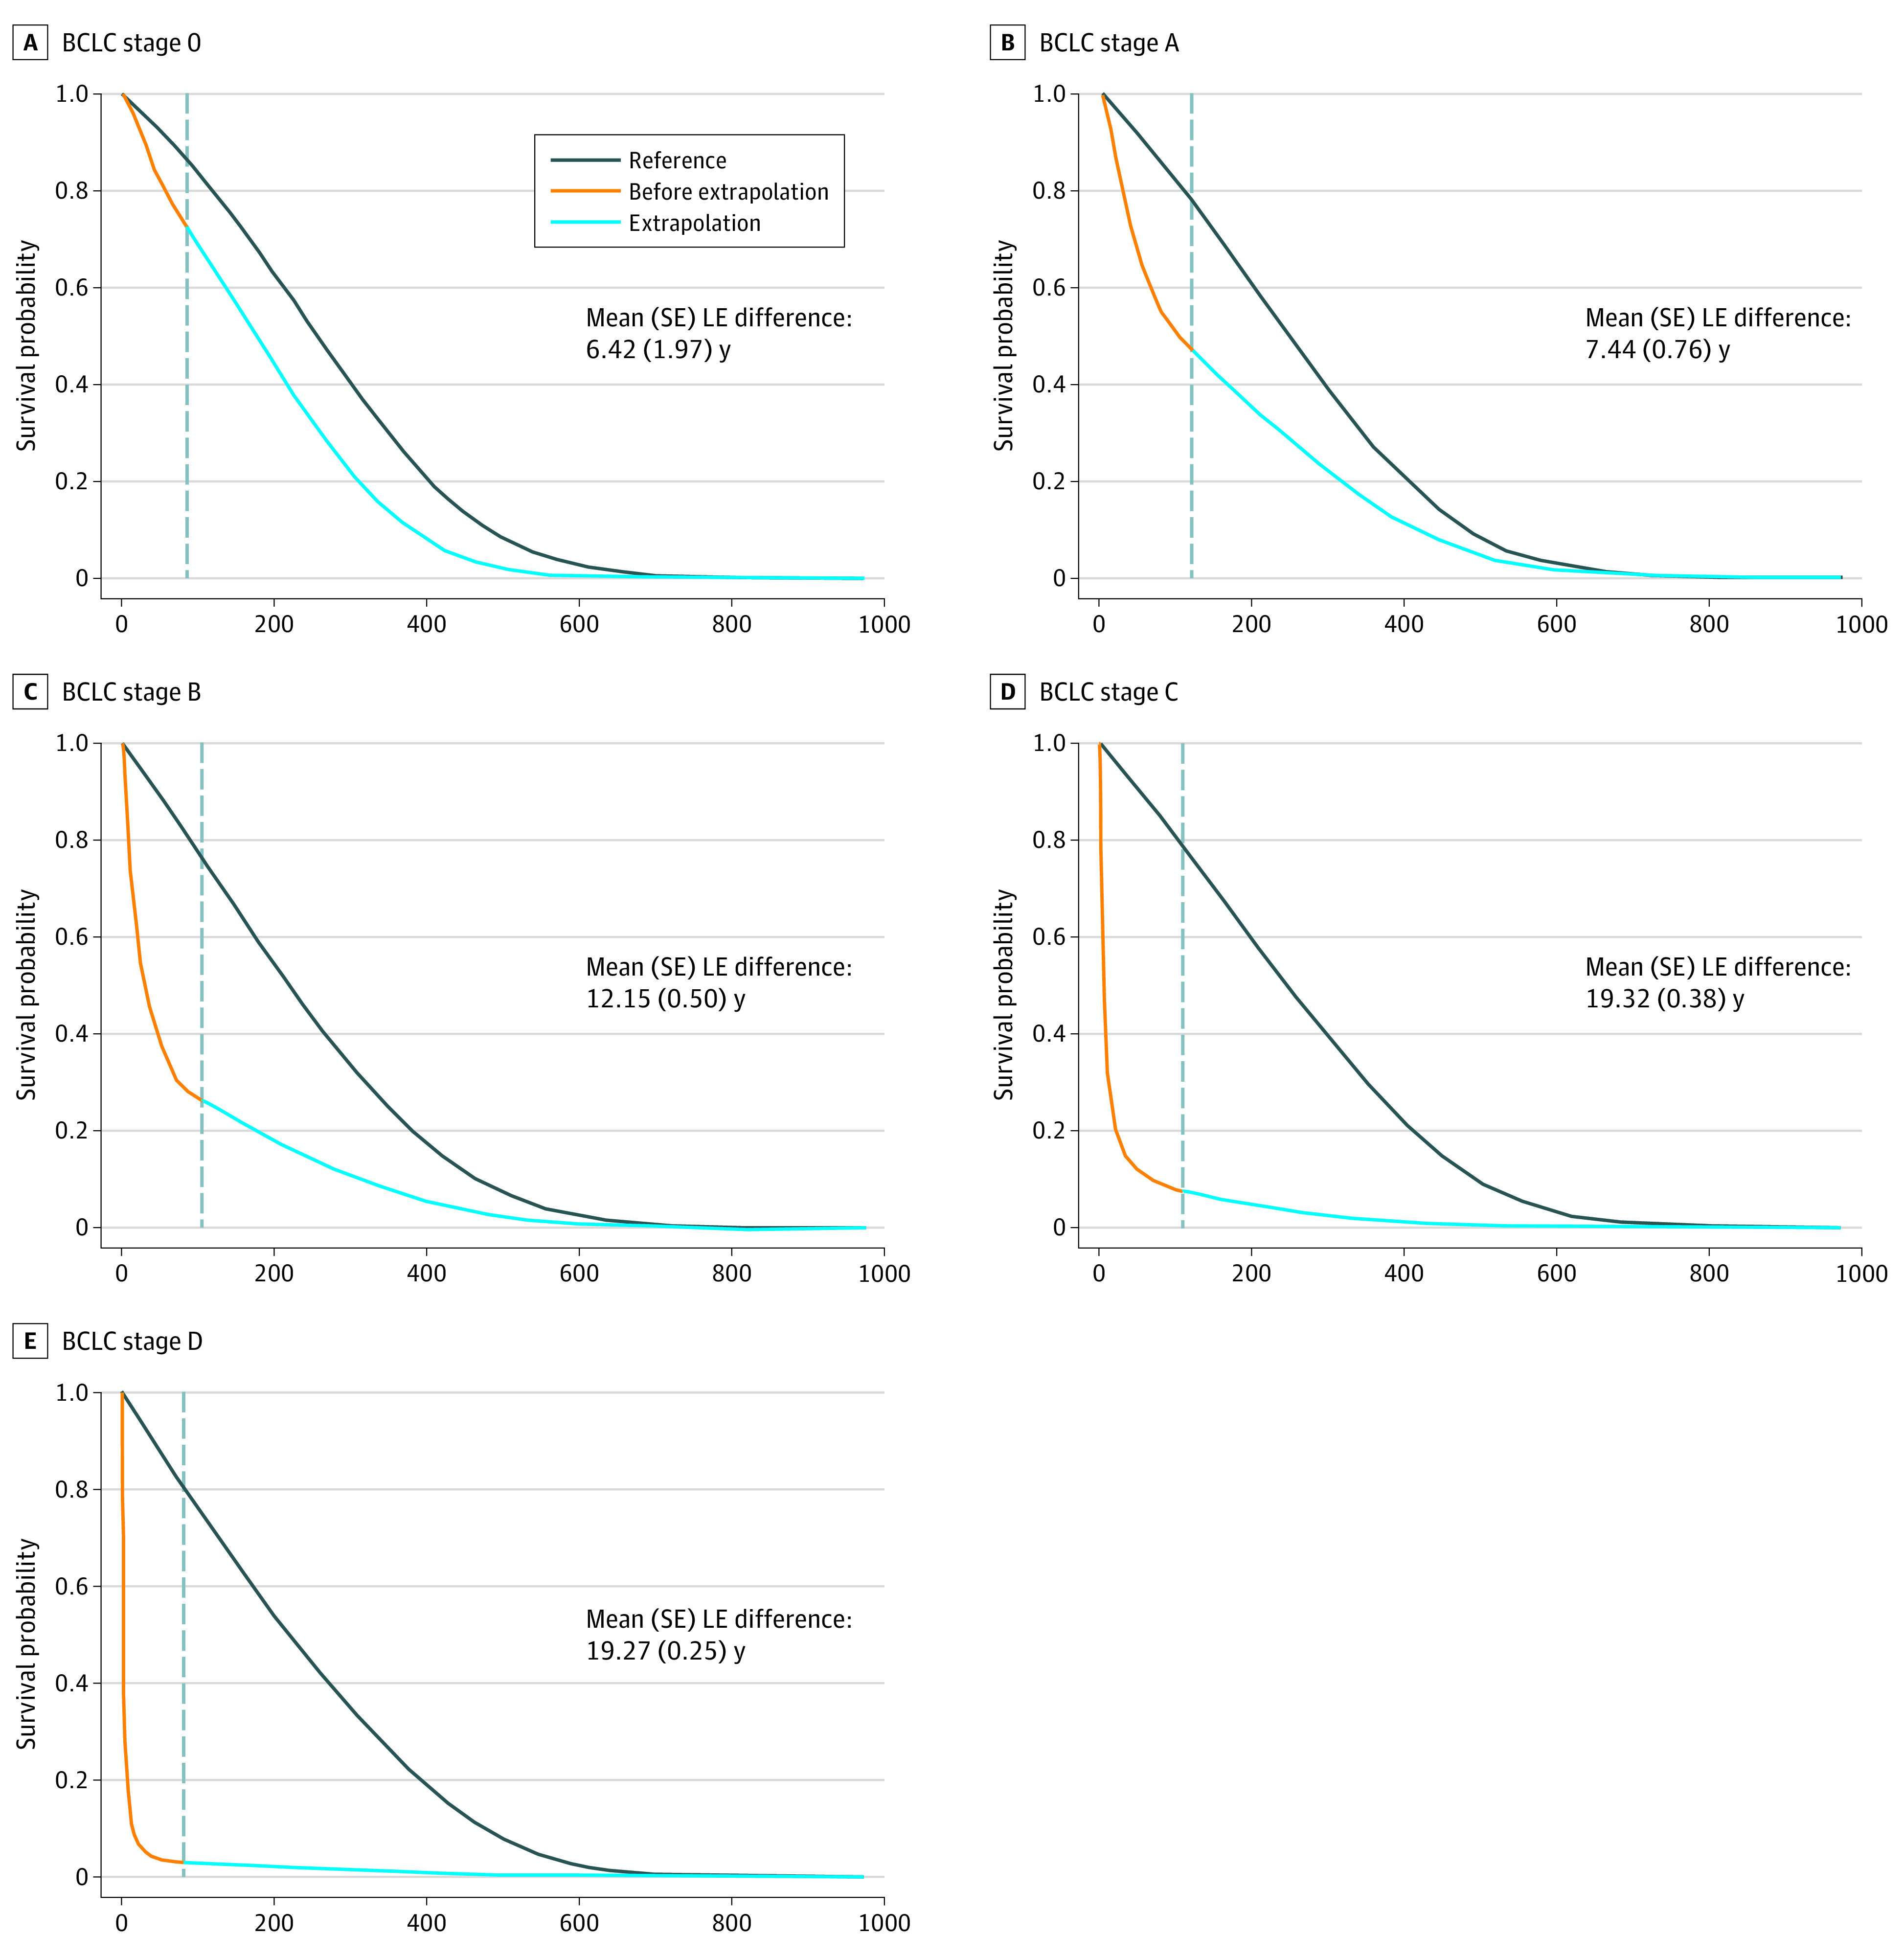
Figure. Loss of Life Expectancy for Men With Hepatocellular Carcinoma Stratified by Barcelona Clinic Liver Cancer (BCLC) Stage.

The gray dashed vertical line in each panel indicates the last month (F) before the extrapolation of survival functions. We selected a month close to the end of follow-up, depending on the sparsity of the observed death events. The values of F in months for these men are 85 for stage 0, 117 for stage A, 105 for stage B, 109 for stage C, and 82 for stage D (eTable 1 in the Supplement). The area between the 2 curves in each panel represents the mean difference in life expectancies (LEs) between men with hepatocellular carcinoma of a specific stage (area below the orange and blue lines) and that of the sex-, age-, and calendar year–matched referents simulated from life tables obtained using Taiwan’s National Vital Statistics (area below the black line).
