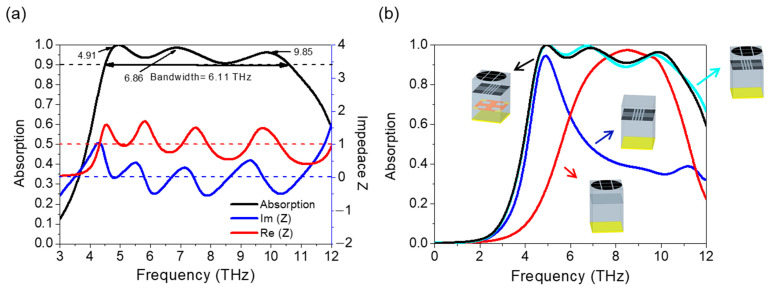
Figure 3.
(a) The absorption curves and normalized impedances of the absorber when μc = 0.8 eV and VO2 is in an insulator state. (b) The absorption curves of different parts of the absorber: the black line represents the absorber with three layers; the blue-green line represents the absorber with two top layers; the blue line represents the absorber with the second layer; and the red line represents the absorber with the top layer.

