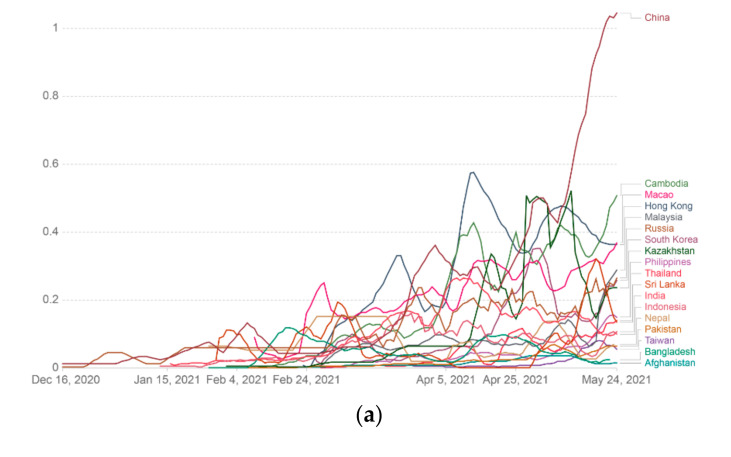
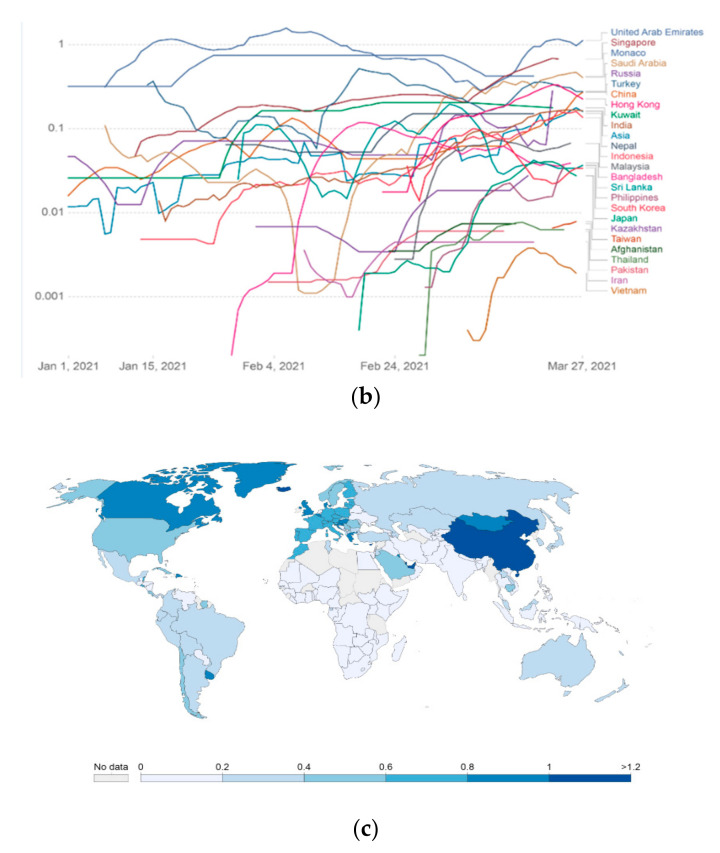
Figure 9.
COVID-19 vaccine rolling 7-day average per 100 people in a country’s total population in different Asian countries. Data counted as single-dose vaccine doses administered per 100 people in the total population up to 24 May 2021. (a) COVID-19 vaccine rolling 7-day average data (doses administered per 100 people) in different Asian countries represented through a linear graph. (b) COVID-19 vaccine rolling 7-day average data (doses administered per 100 people) in various Asian countries represented through the log graph. (c) COVID-19 vaccine rolling 7-day average data (doses administered per 100 people) in different Asian countries represented through the Asian map (data source: Our World in Data).


