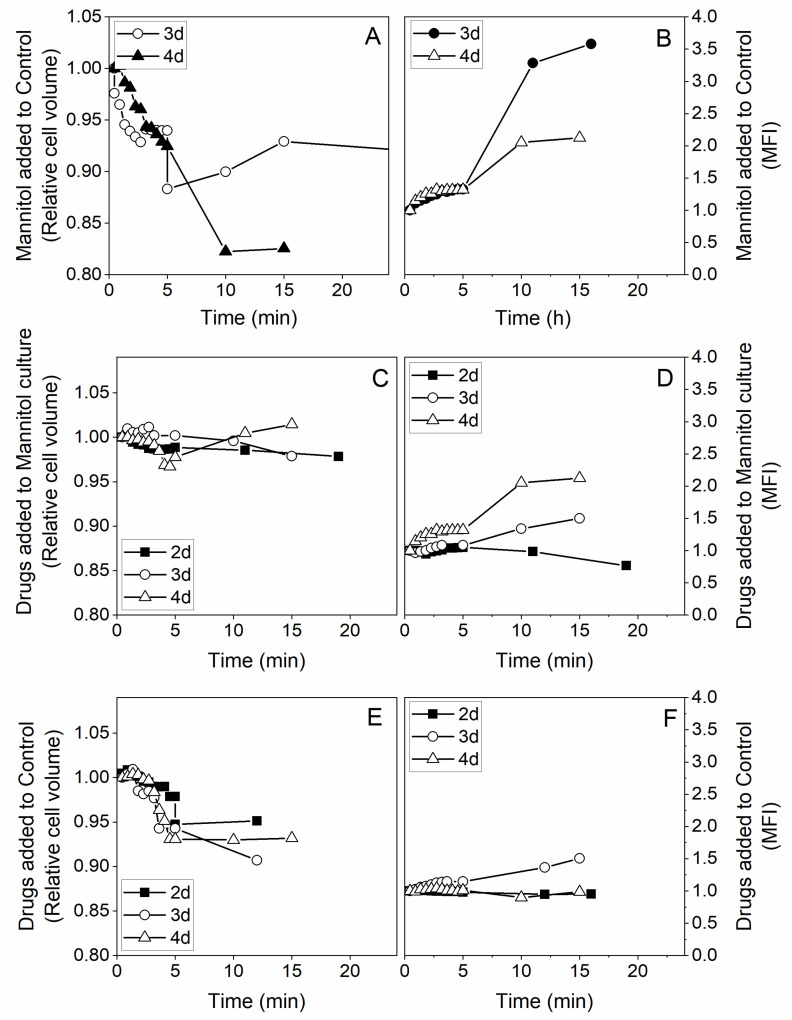
Figure 3.
Early events for the effects of adding hyperosmotic culture conditions combined with lipoic acid and hydroxycitrate drugs. Relative cell volume and mean fluorescence intensity (MFI) monitoring for cells after two days of culture (filled squares), three days of culture (empty circles) and four days of culture (empty triangles). (A) Relative cell volume evolution upon addition of 200 mM final concentration of mannitol to cell culture. (B) MFI of mitochondrial staining with rhodamine 123 upon mannitol addition to cell culture. (C) Relative cell volume for mannitol and combination of ALA and HCA drugs. (D) MFI monitoring of drugs and mannitol cultures. (E) Relative cell volume variation upon ALA and HCA drugs addition to cell cultures. (F) MFI monitoring after drugs addition to control condition. All the figure values are relative units as described in the main text.

