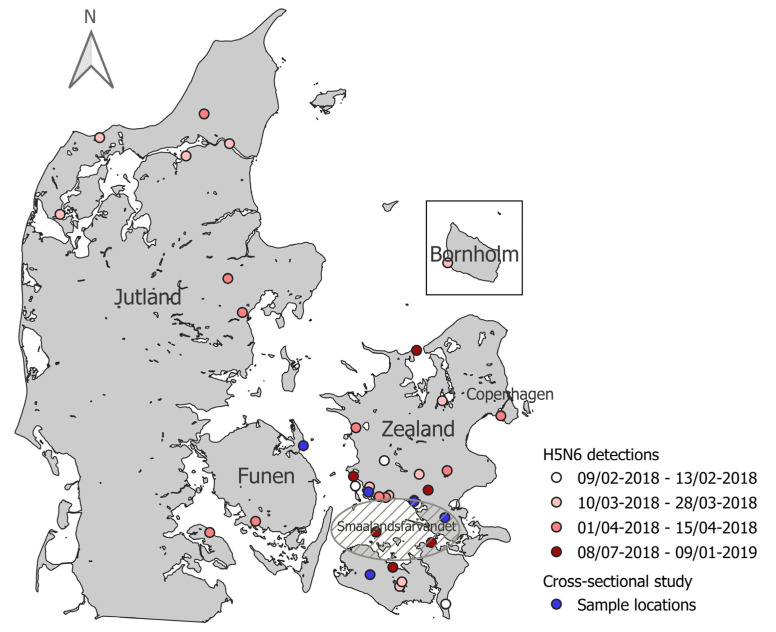
Figure 1.
Geographic distribution of 2.3.4.4b H5N6 HPAIV detections in Denmark and sample locations of the cross-sectional study. Every white, pink, or red point represents one wild bird found dead and infected with H5N6. The gradient from white to red points represents when in the year the detections occurred. The blue points represent the locations where pheasants were collected for the cross-sectional study. Map made with QGIS [35]. Outline of Denmark from Kortforsyningen (www.kortforsyningen.dk, downloaded 26 April 2012).

