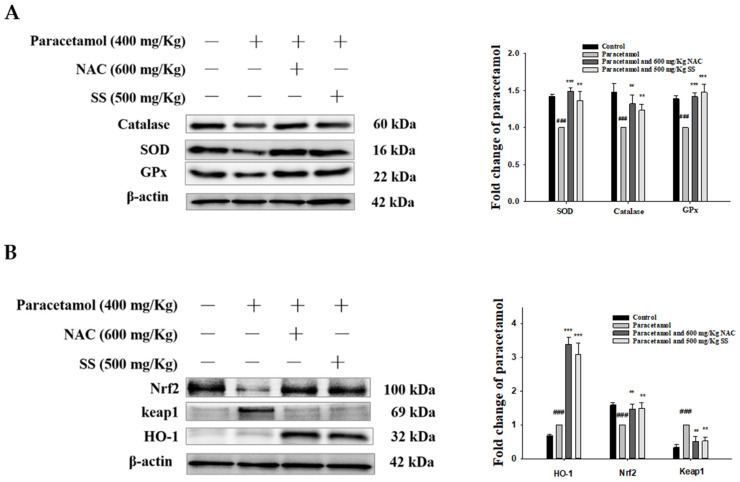
Figure 5.
SS upregulated antioxidant enzymes (catalase, SOD, and GPx) (A) and activated protective mechanisms via Keap1/Nrf2/HO-1 signaling pathway (B) after paracetamol challenge. Total protein was extracted from liver tissues. The protein expression levels were determined by Western blotting. The bands’ intensities were quantified and normalized to those for β-actin. The values are reported as the means ± S.E.M. of five mice per group. ### p < 0.01 relative to the control group; ** p < 0.01 and *** p < 0.001 relative to the paracetamol group.

