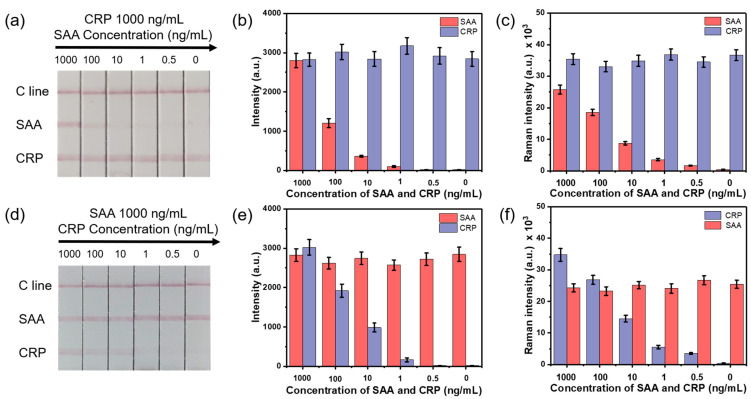
Figure 3.
Sensitivity and specificity of the AuMBA@mSiO2-based LFA strips. (a,d) Photographs of the test LFA strips. (b,e) The corresponding brightness values of two test lines and (c,f) the corresponding Raman intensities at 1079 cm−1 of two test lines. The error bars indicate the standard deviations calculated from five separate experiments.

