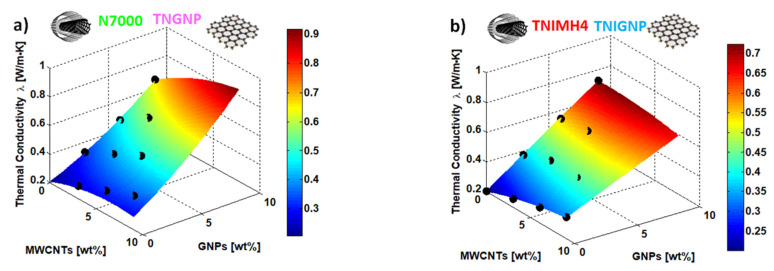
Figure 14.
Response surface plot (full quadratic model) for the thermal conductivity depending upon the controllable input variables in the present study, i.e., the weight percentage of the fillers: N7000 and TNGNP or TNIMH4 and TNIGNP in (a,b), respectively. The black markers are the experimental data regarding thermal characterization.

