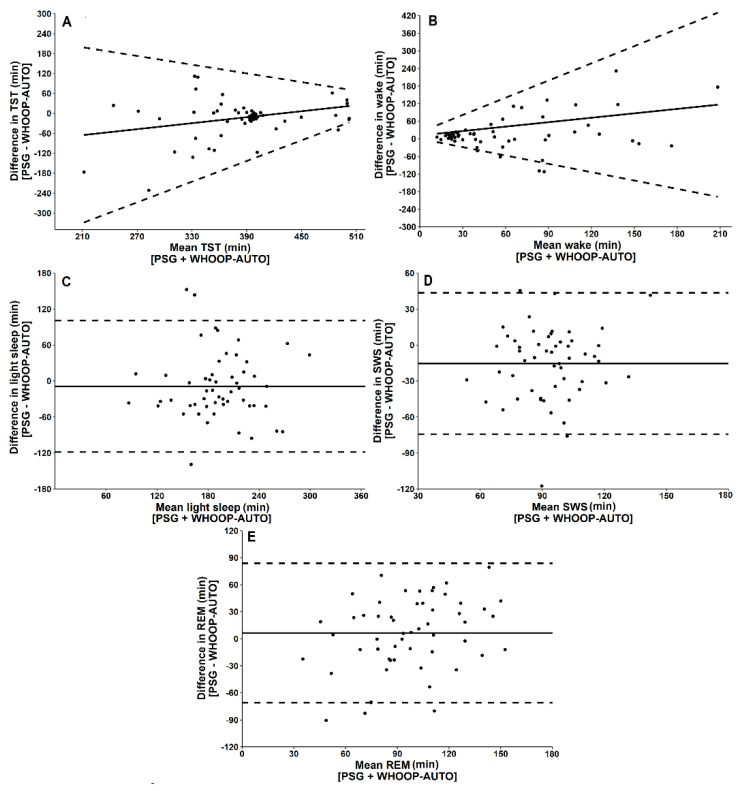
Figure 2.
Bland–Altman plots for WHOOP-AUTO and PSG-derived measures of (A) total sleep time (TST), (B) wake time, (C) light sleep, (D) slow wave sleep (SWS), (E) rapid eye movement sleep (REM). Data points represent one sleep opportunity. The x-axes represent the mean of the values obtained from WHOOP-AUTO and PSG. The y-axes represent the difference between the values, such that positive values indicate that WHOOP-AUTO overestimates relative to PSG and negative values indicate that WHOOP-AUTO underestimates relative to PSG. Solid horizontal lines indicate the mean bias from PSG, and broken lines indicate the 95% limits of agreement (±1.96 standard deviations) [20].

