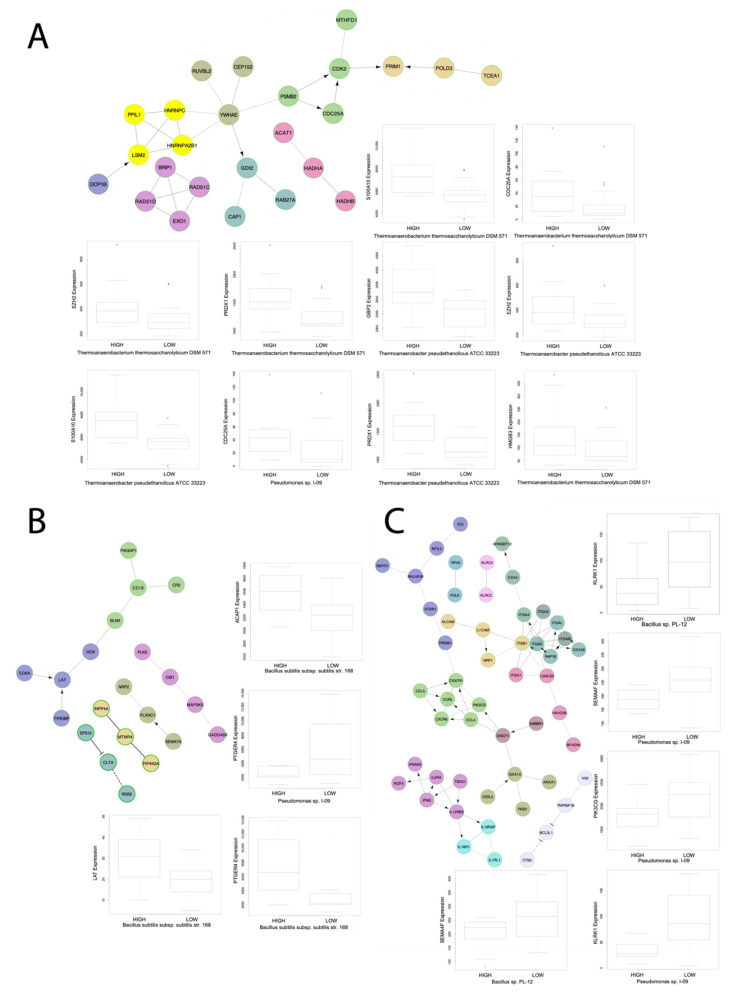
Figure 5.
Select gene networks. Gene networks of GSEA pathways each correlated to three microbes with boxplots of microbe abundance vs. IA gene expression for microbes significantly correlated to IA gene expression for genes found to be enriched within the respective gene network. The gene networks were produced using the Cytoscape Reactome FI software. All boxplots were produced using the Kruskal-Wallis test. The networks are for the immunological signatures (A) GSE17974_CTRL_VS_ACT_IL4_AND_ANTI_IL12_72H_CD4_TCELL_DN, (B) GSE4590_SMALL_VS_LARGE_PRE_BCELL_UP, and (C) GSE3565_DUSP1_VS_WT_SPLENOCYTES_UP.

