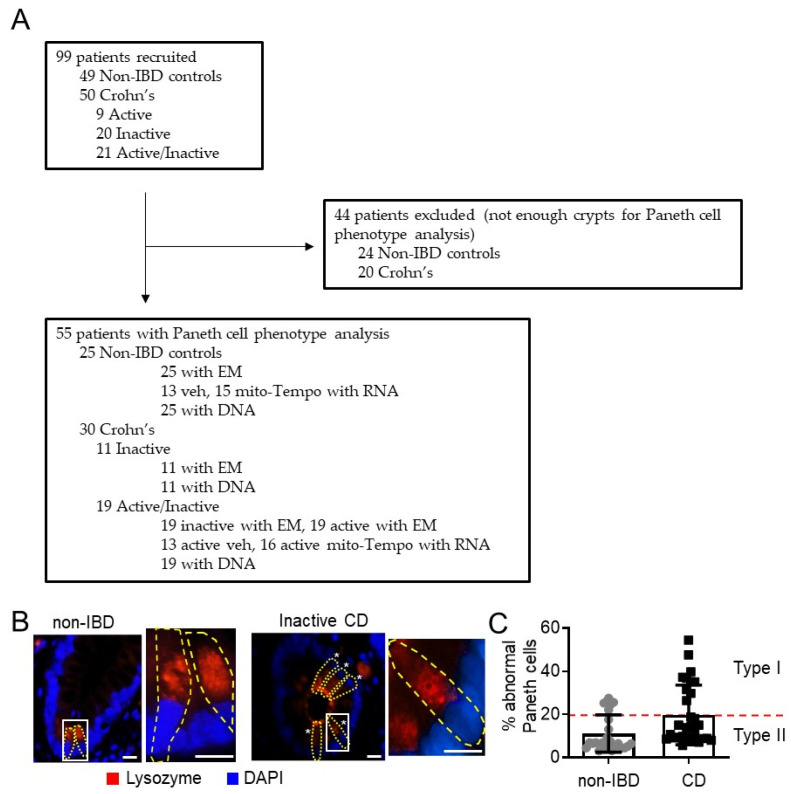
Figure 1.
Flowchart of recruited and excluded patients and Type I Paneth cell phenotyping. (A) Number of patients recruited into analysis for Paneth cell phenotyping, EM, RNA-seq, and presence of autophagy-related SNPs. (B) Example of lysozyme immunofluorescent staining for Paneth cell (yellow outline) phenotype analysis. Star denotes abnormal lysozyme allocation pattern. Box denotes area of higher magnification. Scale bars: 10 μm. (C) % abnormal Paneth cells. A minimum of 40 well-oriented crypts were quantitated for each patient.

