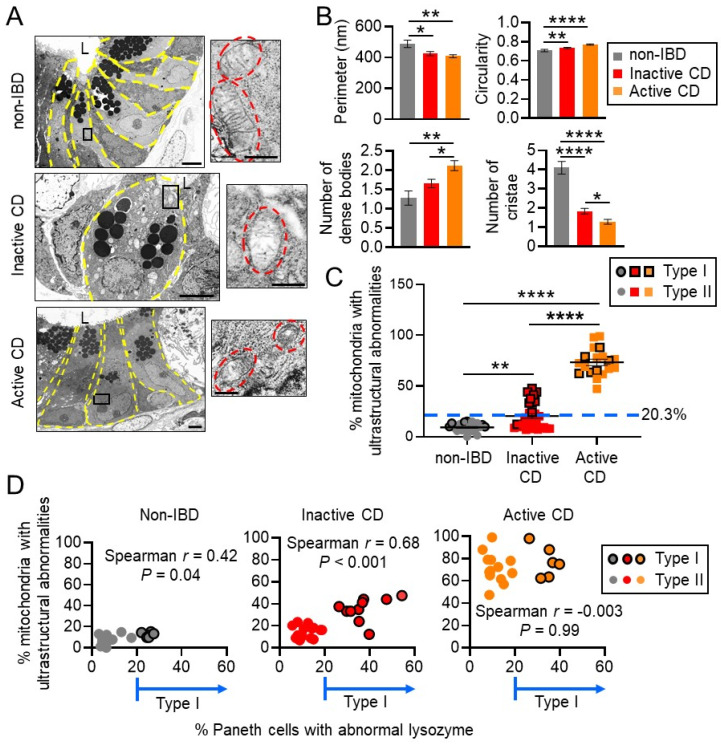
Figure 2.
Ileal CD patients with unhealthy mitochondria stratify as Type I abnormal Paneth cell phenotype. (A) Representative TEM image of Paneth cell (yellow outline) mitochondria (red outline). Scale bars: 4 μm, boxed pullout: 500 nm. L, lumen. (B) Quantitation of mitochondrial parameters in Paneth cells measured by ImageJ fromTEM images. (C) Quantitation of % Paneth cell mitochondria per patient with ultrastructural abnormalities (dissolved cristae, electron-dense inclusion bodies). (D) Spearman’s rank correlation. Results are presented as individual data points ± SEM of 25 non-IBD and 30 inactive CD patients. * p < 0.05, ** p < 0.01, **** p < 0.001 by one-way ANOVA and Tukey’s post hoc test.

