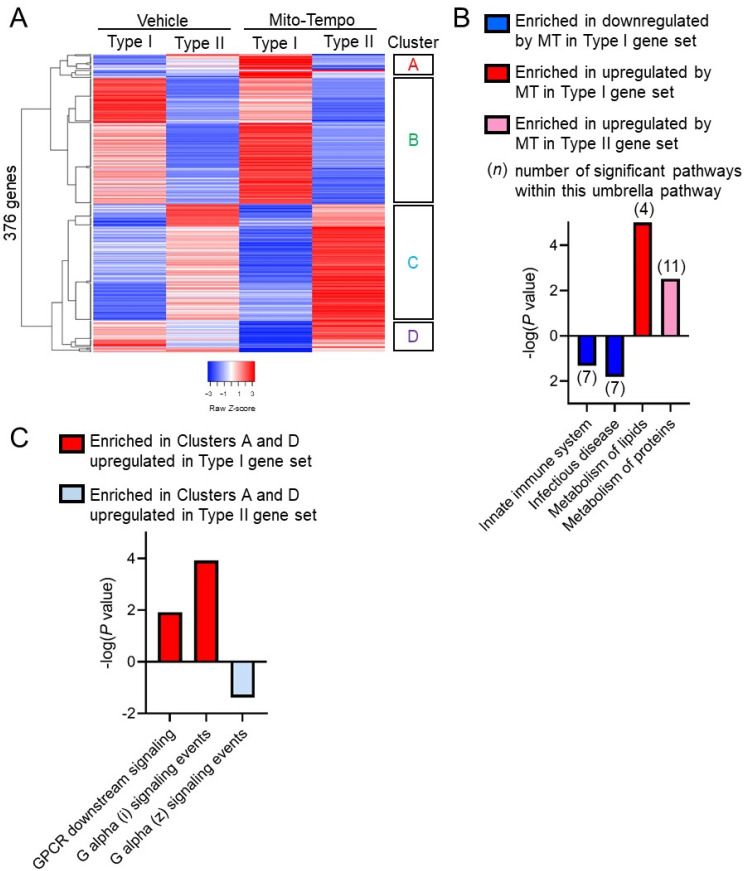
Figure 5.
Paneth cell phenotype is associated with unique Mito-Tempo-induced gene signatures. (A) Heat maps based on hierarchical clustering of gene expression in Type I and Type II Paneth cell phenotype CD patients; (B) significantly enriched pathways by Reactome analysis of logFoldChange > 1.5 DEGs by Mito-Tempo in Type I or II patients; (C) significantly enriched pathways by Reactome analysis of genes in Clusters A and D shown in (A). p < 0.05 was considered significant in pathway selection.

