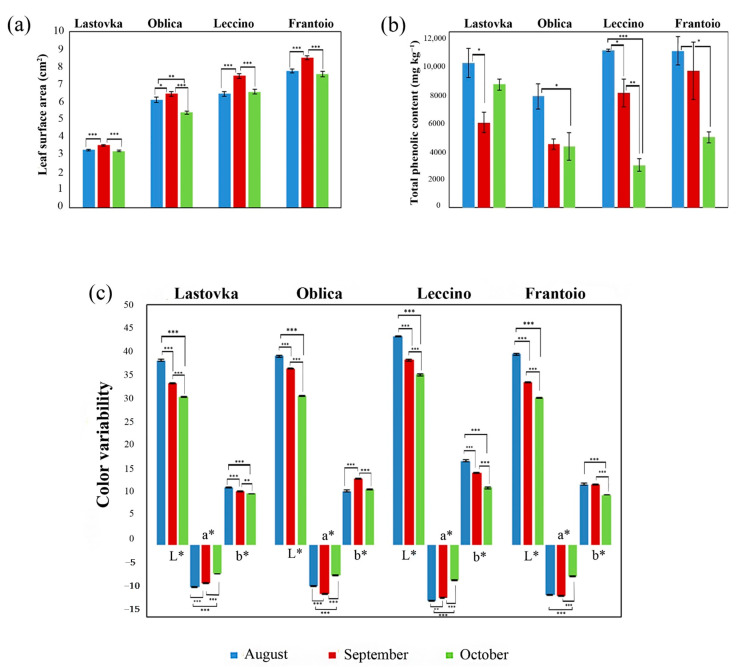
Figure 1.
Graphical representation of the values obtained for surface area, total phenolic amount and color variability of leaves from cvs. Lastovka, Oblica, Leccino and Frantoio at different harvest periods. Statistically significant test result is considered for p ≤ 0.05. * p ≤ 0.05; ** p ≤ 0.01; *** p ≤ 0.001. (a) Difference in leaf surface area from cvs. Lastovka, Oblica, Leccino and Frantoio at 22 August, 12 September, and 25 October (b) Difference in total phenolic content from cvs. Lastovka, Oblica, Leccino and Frantoio at 22 August, 12 September, and 25 October (c) Difference in color variability from cvs. Lastovka, Oblica, Leccino and Frantoio at 22 August, 12 September, and 25 October.

