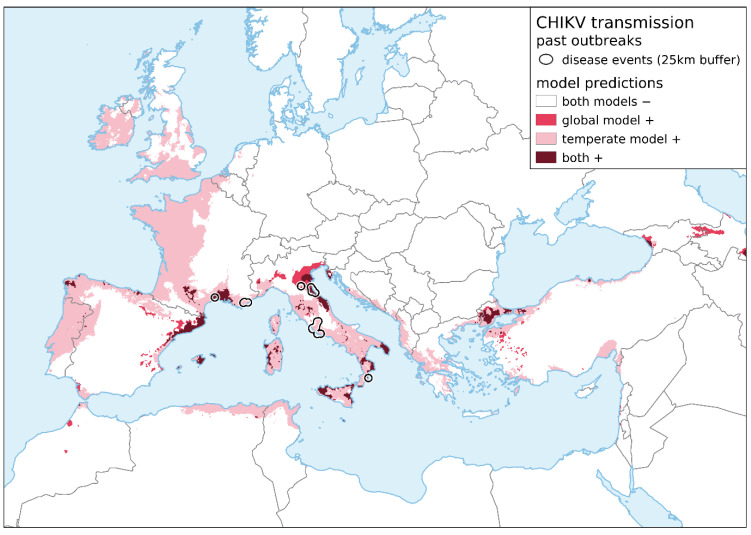
Figure 2.
Comparison of environmental suitability as determined by the global model [48] and the non-tropical model under current climatic conditions. Results from both models were transformed into binary maps according to the 5-percentile threshold and compiled through a map overlay. Autochthonous transmissions of chikungunya are displayed as black polygons (25-km buffer zone around occurrence locations).

