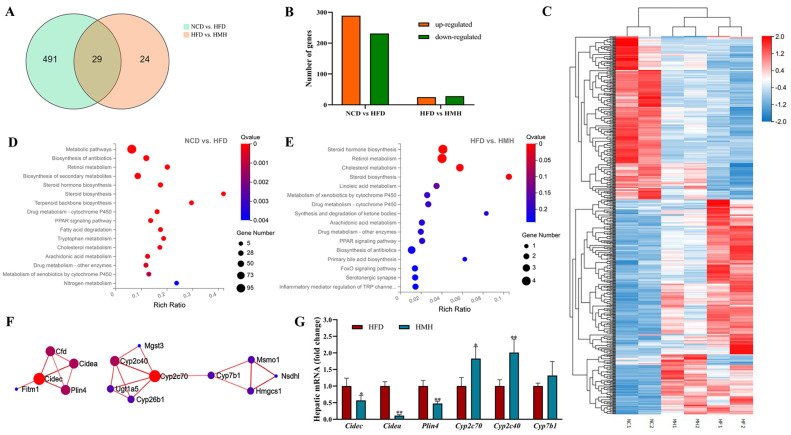
Figure 4.
Effects of matcha on the liver transcriptome of mice. (A) Venn diagram analysis for co-expressed genes derived from RNA sequencing; (B) number of significantly up-regulated and down-regulated genes in comparisons of the NCD and HFD groups or HFD and HMH groups; (C) heatmap that shows the expression pattern of all DEGs and the hierarchical clustering of the liver samples based on the transcriptomic profiles. Red indicates upregulation, blue indicates downregulation; (D,E) KEGG pathway analysis of differentially expressed genes between the NCD and HFD groups or HFD and HMH groups; (F) Cidec and Cyp2c70 related molecular networks—the redder the color, the more significant it is; (G) quantitative real-time PCR of Cidec-related genes and Cyp2c70-related genes. Data are expressed as means ± SEM (n = 3). * p < 0.05, ** p < 0.01 compare to the HFD group.

