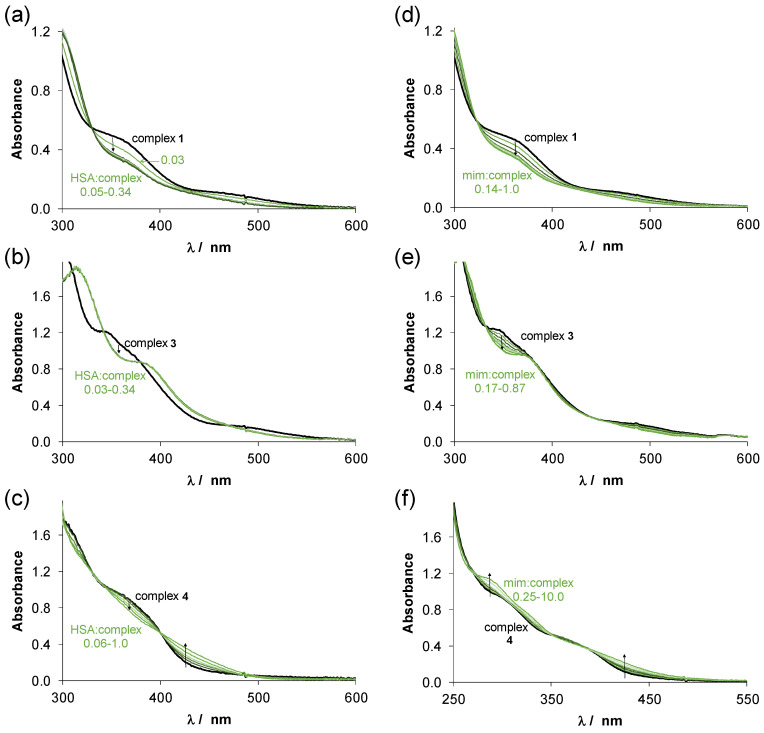
Figure 7.
UV-vis absorption spectra recorded for (a,d) complex 1, (b,e) complex 3 and (c,f) complex 4 in the presence of various equivalents of HSA or mim, respectively at pH = 7.4. The numbers indicate the range of the cHSA/ccomplex or cmim/ccomplex ratios. In case of PTA complexes 24 h incubation time was used. {T = 25.0 °C, pH = 7.40 PBS’ buffer, ccomplex = 210 μM, cHSA= 6.3–71.4 μM or cmim = 29–210 μM (a,b,d,e); ccomplex = 116 μM, cHSA= 6.3–71.4 μM or cmim = 29–1160 μM with 8% (v/v) DMSO (c,f); l = 1 cm}.

