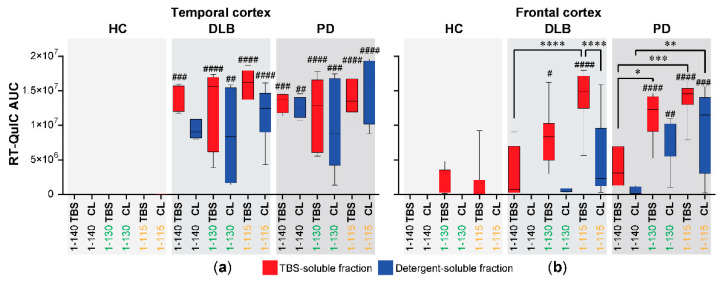
Figure 3.
Comparisons of the aggregation of αSyn forms in RT-QuIC using brain homogenates from PD and DLB cases. TBS-aqueous and detergent-soluble (CelLytic, CL) fractions were prepared from (a) temporal and (b) frontal cortices of 8 cases of DLB, PD, or healthy controls (HC), then assayed by RT-QuIC using three different αSyn forms (full length 1-140 and truncated forms 1-130 or 1-115). The RT-QuIC reactions are shown in Figure 2. The box plots (median marked with a line and with maximum and minimum bars) summarize the area under the RT-QuIC curves (AUC). One-way ANOVA with Tukey’s multiple comparison testing (GraphPad Prism) was used for statistical comparisons. Hashtags denote significant differences in comparison to healthy controls (HC); # p < 0.05, ## p < 0.01, ### p < 0.001, #### p < 0.0001. Asterisks denote significant differences within DLB or PD; * p < 0.05, ** p < 0.01, *** p < 0.001, **** p < 0.0001.

