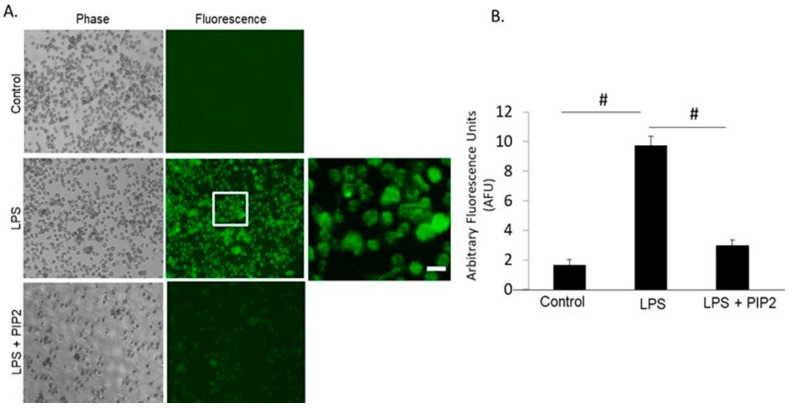
Figure 2.
Inhibition of H2O2 production by PIP-2 in HL60 cells. (A). Fluorescent images of HL60 cells under control (liposomes alone), LPS + liposomes, or LPS + PIP-2 in liposomes. Images were acquired at λexcitation = 488 nm. A. All images were acquired with the same exposure and acquisition settings. The area enclosed by the box in the middle panel is shown at higher magnification in the far-right panel. Scale bar is 10 µm. (B). The integrated fluorescence intensity generated by HL60 cells across several microscopic fields (n = 3) was quantified using MetaMorph Imaging software. Intensity of fluorescence was normalized to area. The data is expressed as mean ± SD for n = 3 independent experiments. # p < 0.001 for the indicated comparisons.

