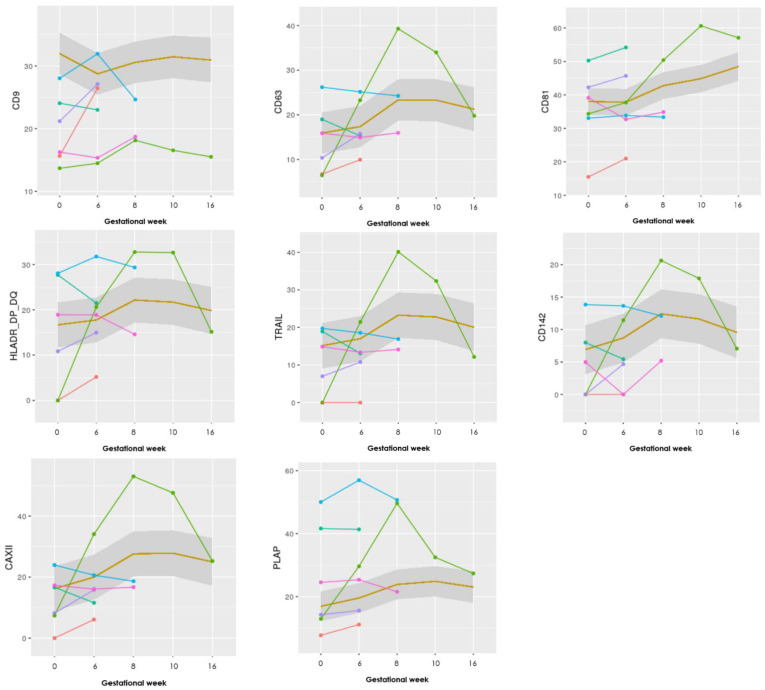
Figure 1.
Graphs showing the progression of eight EV markers examined in the EV Array. The LB group (n = 25) is illustrated as a mean within the grey box, whereas the PL group (n = 6) is individually visualized with six different colors. Gestational week is depicted on the x-axis and absolute levels of the marker along the y-axis (the remaining nine markers can be seen in Appendix B).

