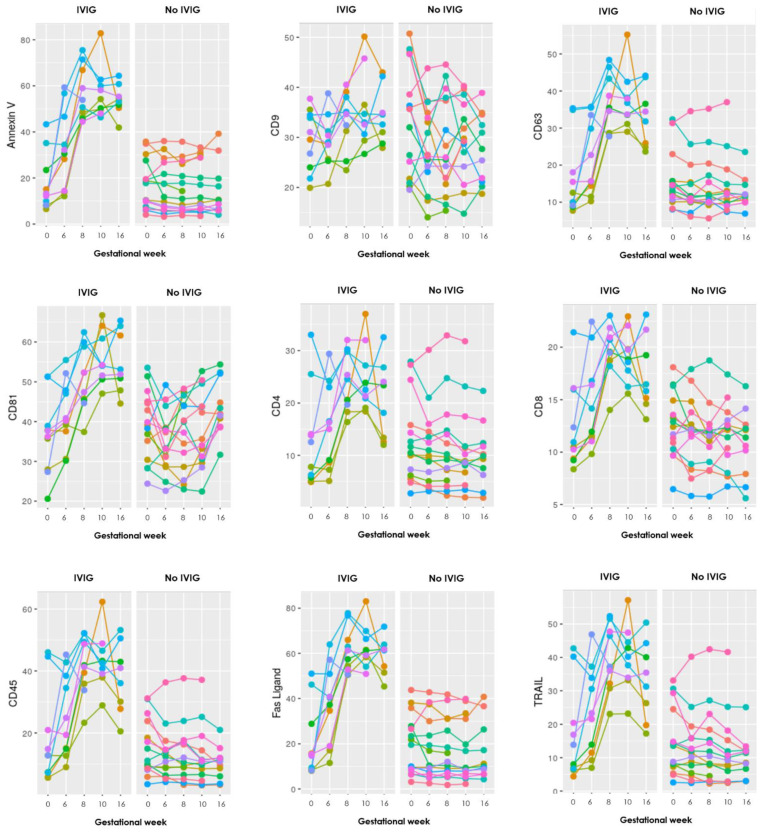
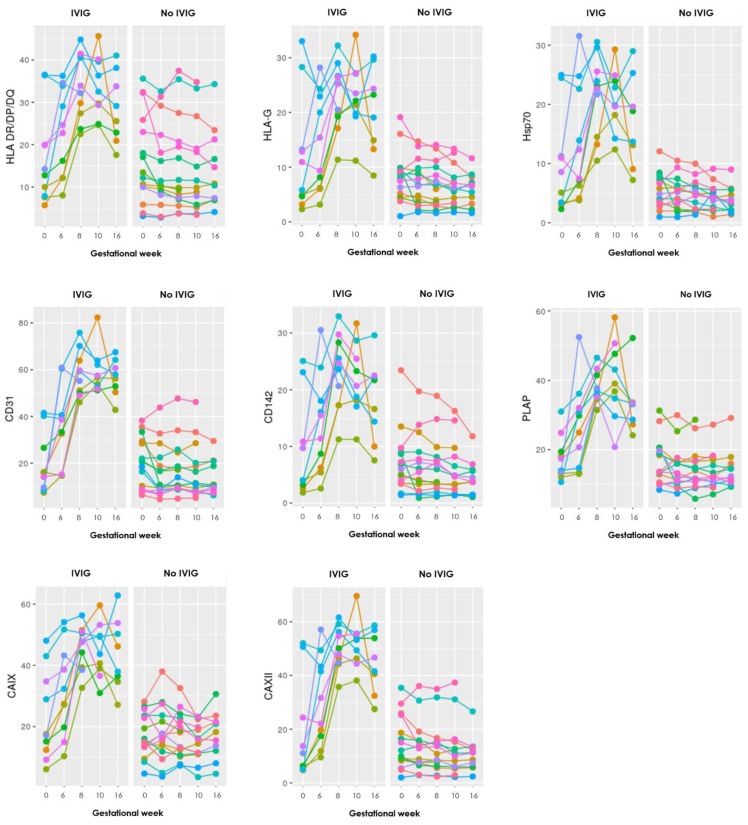
Figure A2.
Graphs showing the progression during pregnancy of all 17 EV markers examined with the EV array in the LB group, where each color represents an individual person. To the left are those who received IVIG treatment and to the right those who did not. Gestational week is depicted on the x-axis and absolute levels of the antibody marker along the y-axis.


