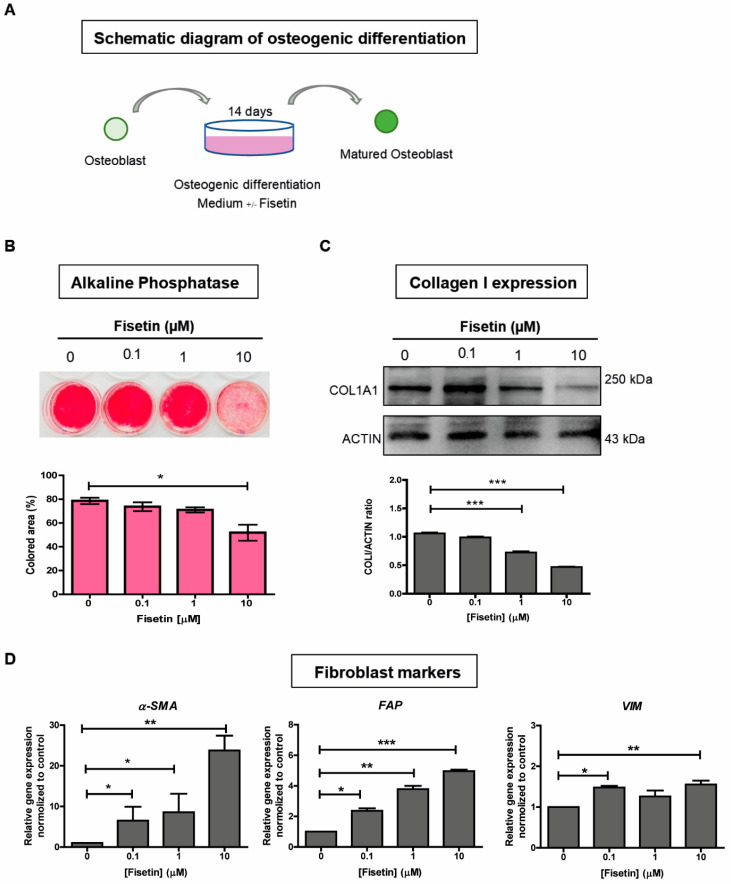
Figure 4.
Fisetin inhibits osteogenic differentiation of SaOs-2 cells. Schematic diagram of osteogenic differentiation to induce osteoblasts to become mature osteoblasts (A). Alkaline phosphatase staining and colored area measurement (B). Expression of the COL1A1 protein as determined by Western blot analysis, and the ratio of COL1A1 to ACTIN (C). Quantitative analysis for the transcriptional expression of mesenchyme and fibroblast markers after SaOs-2 cells were treated with fisetin (D). The data presented in subfigure (B–D) were analyzed by Mann–Whitney U test. Bars indicate mean values ± standard deviation (SD) and asterisks indicate significant differences, * p < 0.05; ** p < 0.01; *** p < 0.001.

