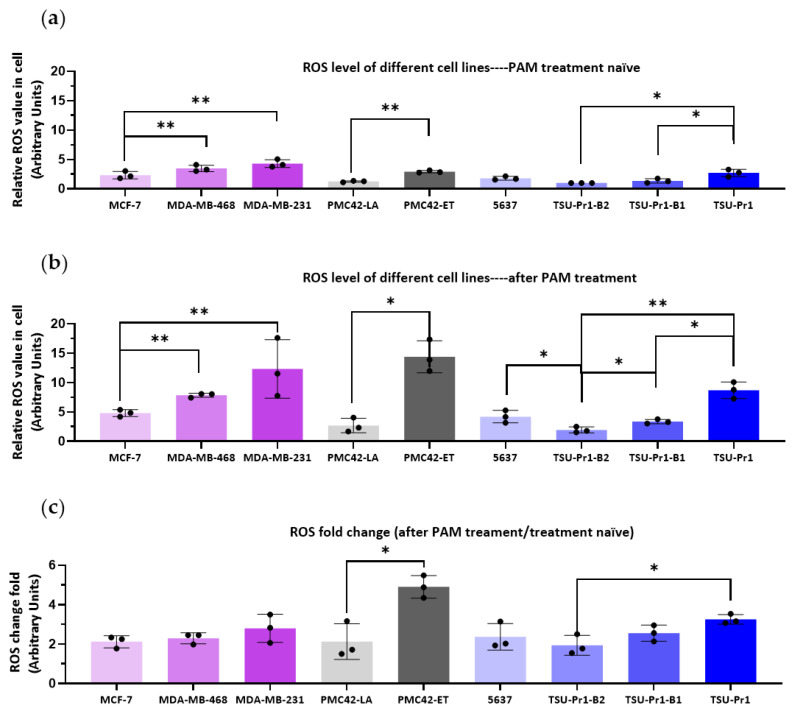
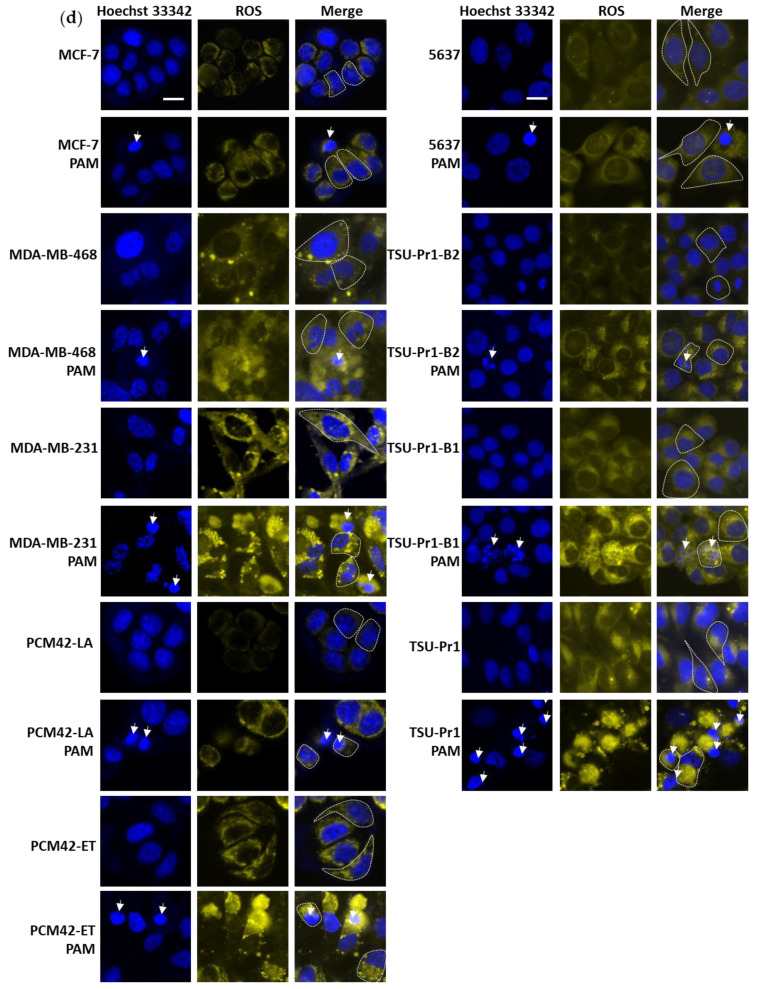
Figure 2.
The effect of PAM on ROS levels in breast and bladder cancer cell lines. Breast cancer cell lines (MDA-MB-231, MDA-MB-468, MCF-7; pink) and EMT/MET cell line systems in breast (PMC42-ET/LA; grey) and bladder cancer (5673, TSU-Pr1/B1/B2; blue) were plated in a 96-well plate at 5000 cells per well overnight. After 3 h serum starvation, cells were incubated with CellROX Orange for 30 min in the incubator for ROS staining, then washed twice with PBS and stained with Hoechst 33342 for 15 min. The fluorescent images were taken by InCell 2000 and quantified by IN Carta. (a) The relative ROS level in the absence of PAM treatment compared to the level in TSU-Pr1-B2 cells. (b) ROS levels after 12h 70% 10PAM. (c) Fold change in ROS after 12 h 70% 10PAM (as per B) compared to resting state (as per A). (d) Fluorescent staining of ROS for each cell line in the resting state and after 12 h 70% 10PAM treatment, for the same cell lines as above (a). Nucleus is stained blue, ROS staining is yellow, and the merge of these is shown, as labeled. White arrows indicate dead or dying cells identified by disrupted nuclear morphology. The cell perimeters are outlined with white dashed lines. Bar = 5 μM. The mean and SEM of the average for each data point from each of the 3 experiments are shown. “*” represents p < 0.05, and “**” represents p < 0.01.


