Figure 7.
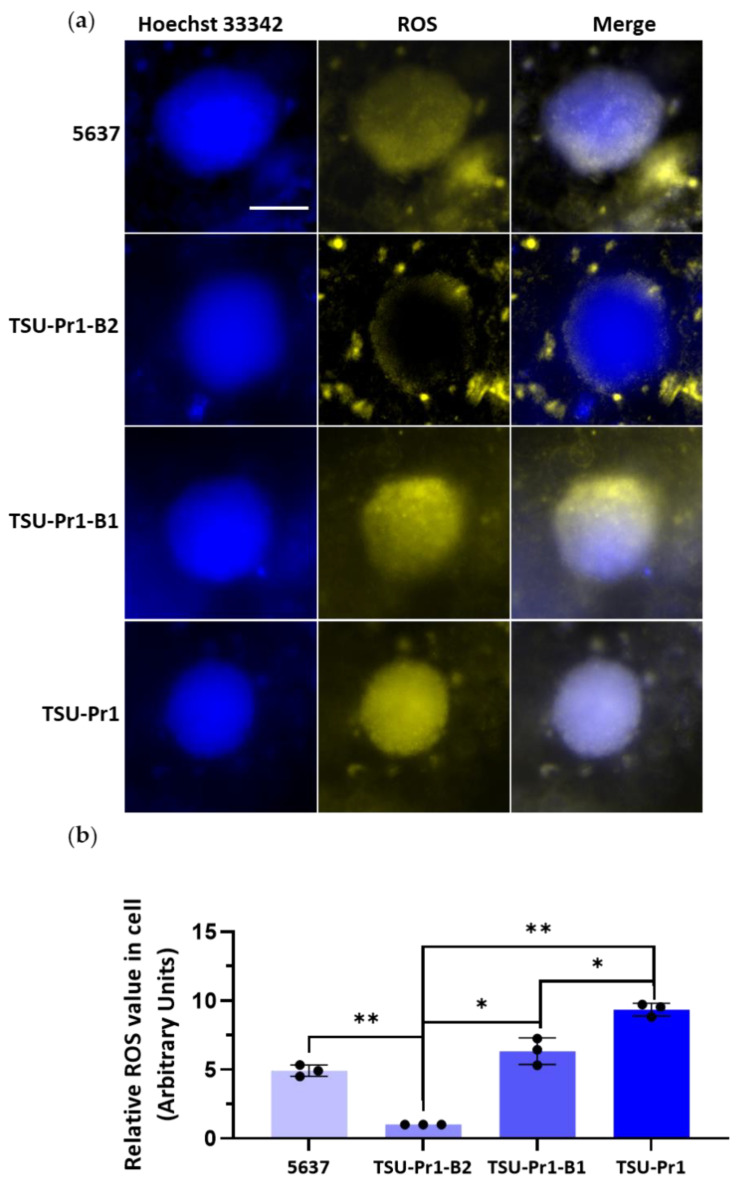
ROS level of PAM-treated 3D bladder cancer cell spheroids. (a) Representative images of ROS staining. After 6 days of 50% 10PAM treatment, the four cell line spheroids were stained for ROS and images were taken. DNA was assessed with Hoechst 33342 in blue and ROS staining with CellROX in yellow. The use of both of these stains in conjunction with the confocal capability of the InCell 6500HS instrumentation shows that the ROS staining is at the edge/surface, either surrounding the cell mass reflected by DNA staining (as in TSU-Pr1-B2) or above or below as in the other cell lines depicted. Scale = 100 µm. (b) The quantification of ROS level. Average of 3 technical replicates normalized to TSU-Pr1-B2 ROS luminescence. N = 1. These results are from a single pilot experiment with 10 spheroids for each treatment group. “*” represents a p < 0.05 and “**” represents a p < 0.01.

