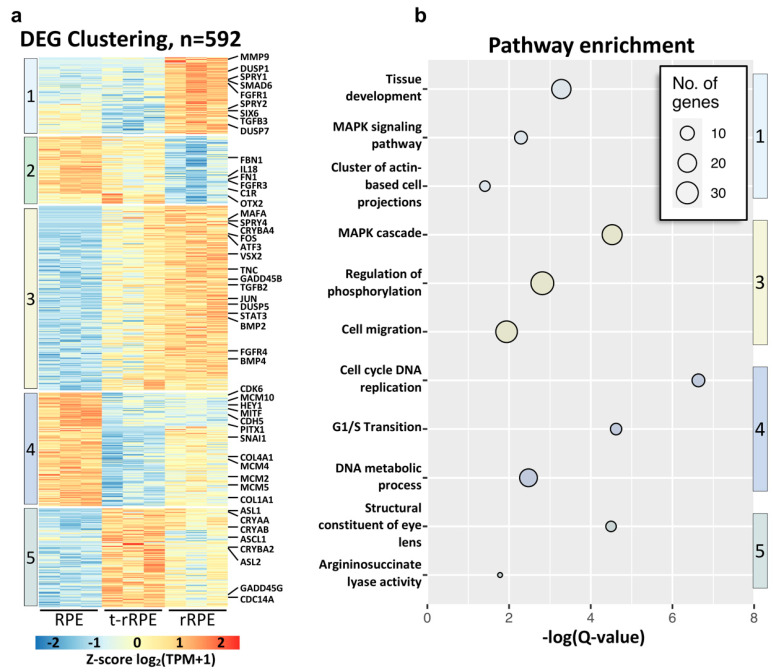
Figure 4.
Clustering reveals gene expression dynamics during RPE reprogramming. (a) Affinity propagation clustering of 592 non-redundant DEGs delineated five gene clusters adhering to unique expression patterns. The heatmap is row-normalized and notable genes associated with retinal development and regeneration are annotated on the right. (b) Bubble chart displays key terms associated with each DEG cluster. The size of each bubble represents the number of DEGs identified for each term; the color of each bubble is associated with the cluster number from (a).

