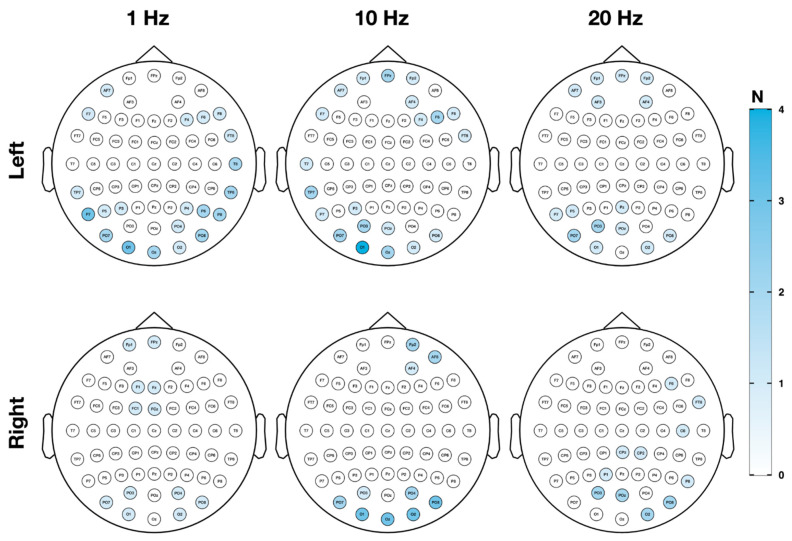
Figure 4.
Topography of electrophysiological response—alpha responder. In Figure 4, topography and quantity of sensors showing sham-superior increases in the alpha frequency band in a minimum number of two neighboring channels on both test session days are illustrated per rTMS protocol. Responses in the alpha frequency band (8–12.5 Hz) to one of the verum protocols primarily occurred over parieto-occipital electrodes.

