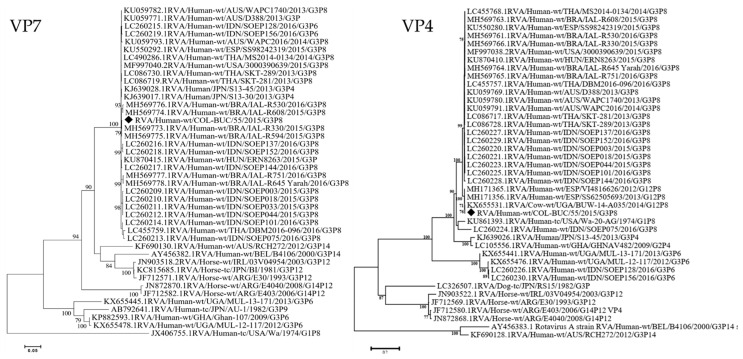
Figure 1.
RVA VP7 (G)/VP4 [P] Maximum Likelihood Phylogeny. The trees with the highest log likelihood are shown. The percentage of trees in which the associated taxa clustered together is shown next to the branches. The tree is drawn to scale, with branch lengths measured in the number of substitutions per site. All positions containing gaps and missing data were eliminated. Bootstrap values lower than 70% are not shown. Black Diamonds (♦) indicate the Colombian G3P[8] strain in this study compared with other representative human and animal strains from the GenBank database. Evolutionary analyses were conducted in MEGA7.

