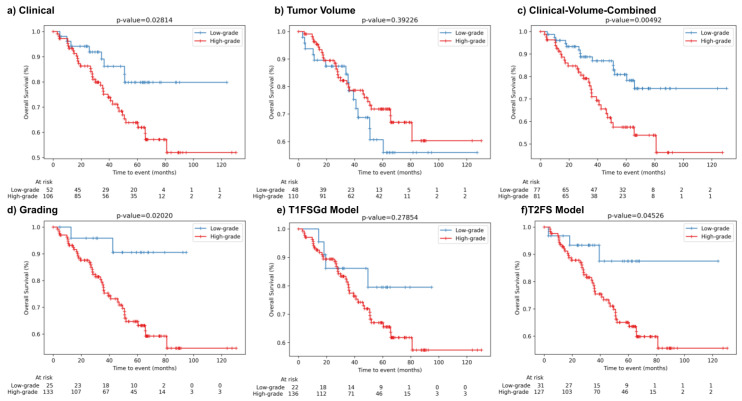
Figure 3.
Patient risk stratification in the independent test set. Kaplan Meier survival curves for patients’ overall survival displaying risk stratification of the developed models on the test cohort. (a) Clinical, (b) Tumor-Volume, (c) Clinical-Volume-Combined, (d) Grading (low-grade vs. high-grade), (e) DL-T1FSGd, and (f) DL-T2FS. Depicted p-values describe the results of the log-rank test.

