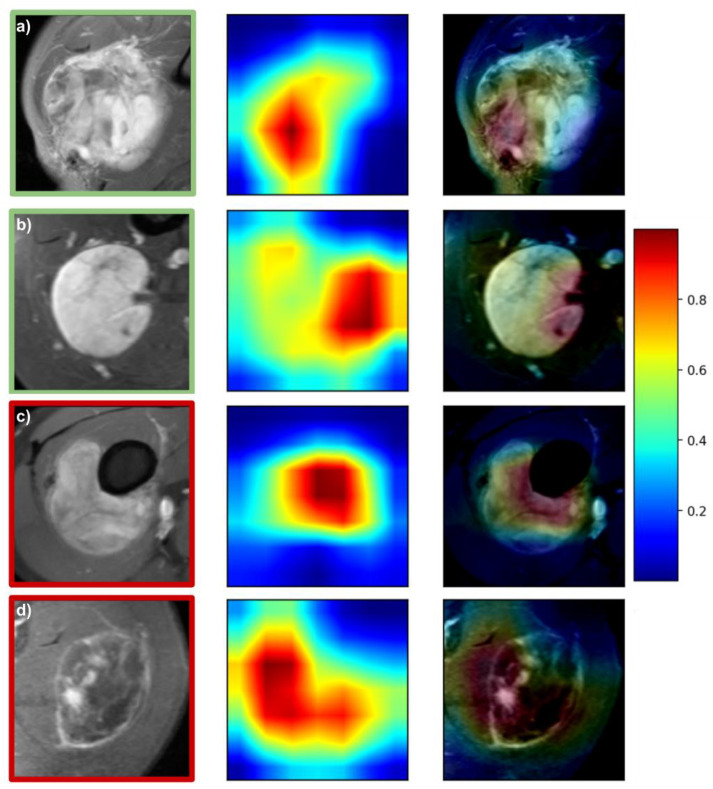
Figure 4.
Attention maps of the DL-T1FSGd model. Green and red squares around images denote correct and false predictions, respectively: (a) correct prediction with 87% probability: high-grade (G2) synovial sarcoma—focus on tumor texture and tumor-tissue border with low confinement; (b) correct prediction with 95% probability: low-grade (G1) myxoid liposarcoma—focus on tumor-vessel interface with good confinement. (c) False prediction with 87% probability: low-grade (G1) myxoid liposarcoma—focus on tumor-bone interface. (d) False prediction with 98% probability: high-grade (G3) pleomorphic sarcoma—focus on central tumor parts and tumor-tissue border, low in-plane resolution.

