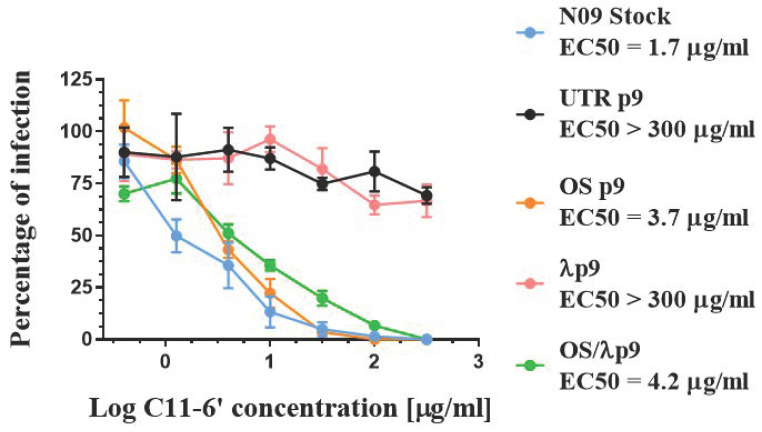
Figure 6.
Dose–response curves demonstrating the antiviral activity of C11-6′ when pre-incubated with A(H1N1)pdm09 variants before infection in MDCK cells. OS p9 = virus passaged nine times in the presence of OS alone; λ p9 = virus passaged nine times in the presence of IFN λ1 alone; OS/λ p9 = virus passaged nine times in the presence of OS plus IFN λ1; UTR p9 = virus passaged nine times in the absence of selective drug pressure; N09 Stock = virus produced in MDCK cells and never passaged in Calu-3. Mean EC50 values and standard deviations were calculated from two independent experiments performed in duplicate.

