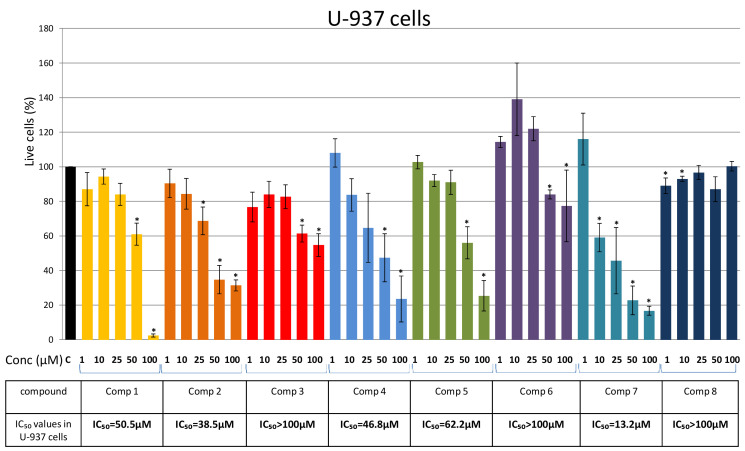
Figure 4.
Effects of Compounds 1–8 on U-937 cells. Cells were treated for 48 h with increasing concentrations (1 μM, 10 μM, 25 μM, 50 μM, and 100 μM) of the tested compounds and cell viability was assessed using an MTS assay and expressed as the percentage of absorbance relative to the vehicle control (U-937 cells treated with DMSO), which was set at 100%. Data are presented as the mean ± SEM of at least three independent experiments. An asterisk denotes a significant difference from the control (* p < 0.05). SEM—standard error of the mean.

