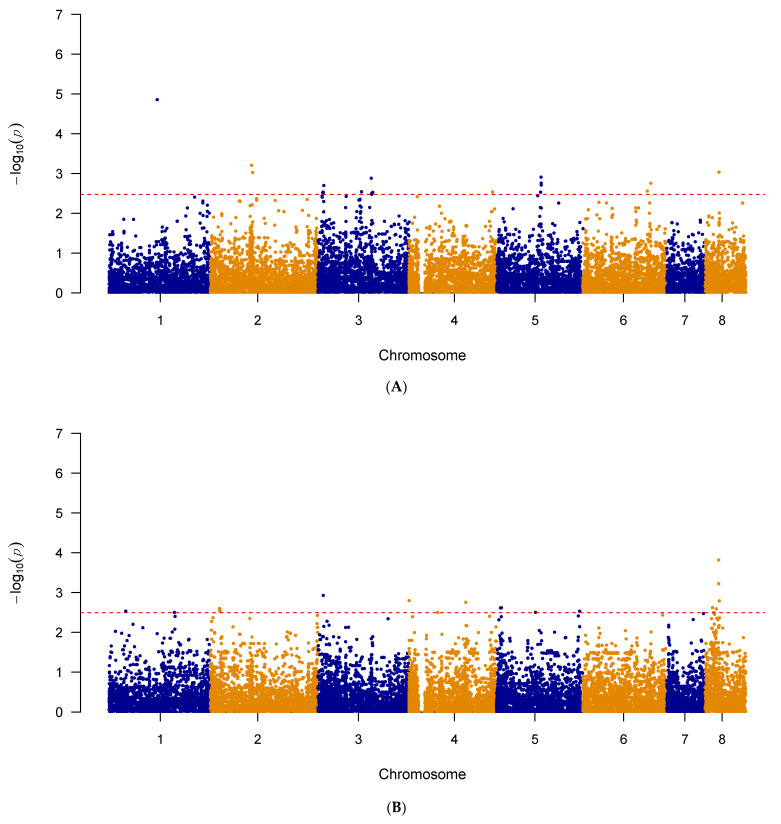
Figure 5.
The Manhattan plot showing genome-wide SNPs associated with triazole resistance in A. fumigatus in Clade II (A) SNPs associated with itraconazole resistance in A. fumigatus isolates (n = 71) and (B) SNPs associated with voriconazole resistance in A. fumigatus isolates (n = 72). The top 20 SNPs in each analysis are separated out by the red dashed line. The plot is depicted with chromosome position on the X-axis and the −log10(p-value) on the Y-axis.

