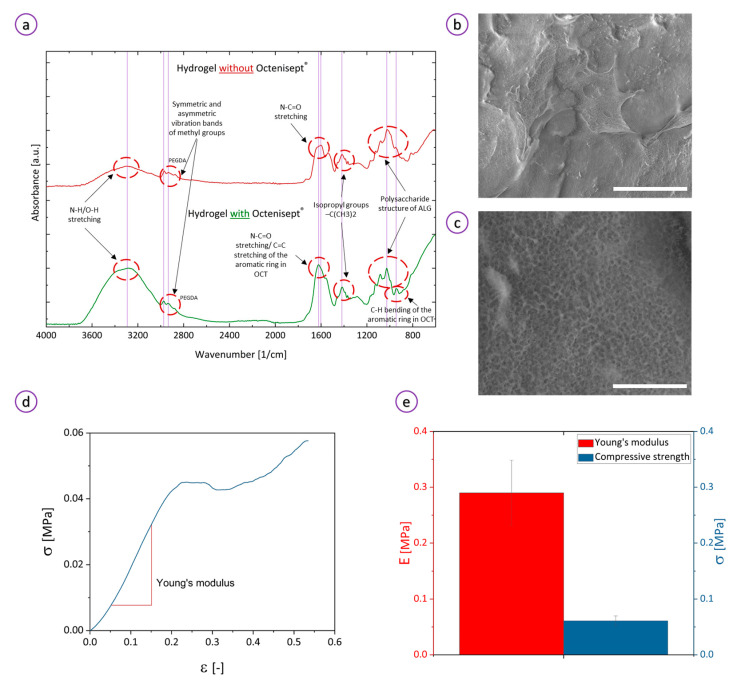
Figure 3.
Hydrogel characterization: (a) ATR-FTIR spectrum of the 3D-printed sample with (top) and without (bottom) OCT; (b,c) cryo-SEM images of the cross-sectional microstructure of the specimens. Bars correspond to 40 and 5 μm, respectively; (d) stress–strain curve of the hydrogel; (e) Young’s modulus and compression strength of the material.

