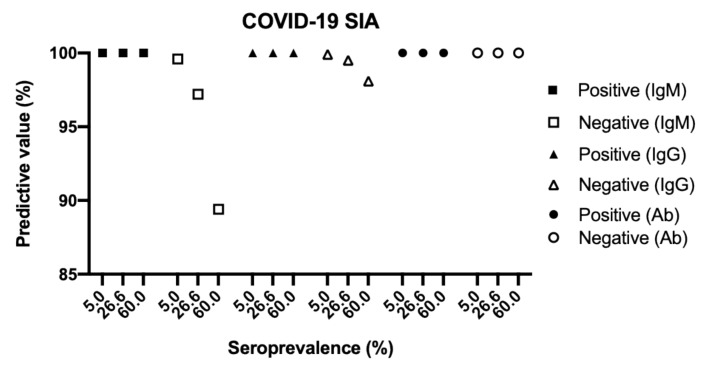
Figure 2.
Predictive values of the COVID-19 SIA at three different seroprevalences. The predictive values were plotted as a function of seroprevalence using the values for sensitivity and specificity in Table 4 and the following formulas: Positive predictive value = (seroprevalence * sensitivity) / ((seroprevalence * sensitivity) + ((1 − seroprevalence) * (1 − specificity))); Negative predictive value = ((1 − seroprevalence) * specificity) / ((seroprevalence * (1 – sensitivity)) + ((1 – seroprevalence) * specificity)). COVID-19, Coronavirus disease 2019; SIA, suspension immunoassay; Ig, immunoglobulin, Ab, IgM + IgG.

