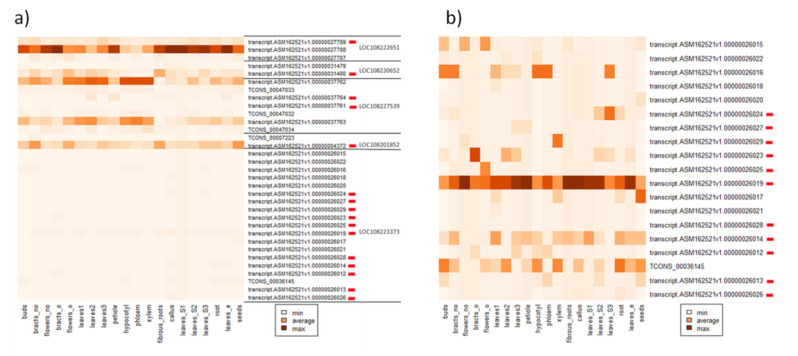
Figure 3.
Heatmap of the expression (TPM, transcript per million) of five genes (a) and LOC108223373 (b) producing hAT-containing isoforms (labeled by red rectangles). Expression was normalized by tissue type to allow comparisons between genes and isoforms. Novel isoforms are labeled as TCONS_XXX. Detailed results/descriptions are provided in Supplementary File S3.

