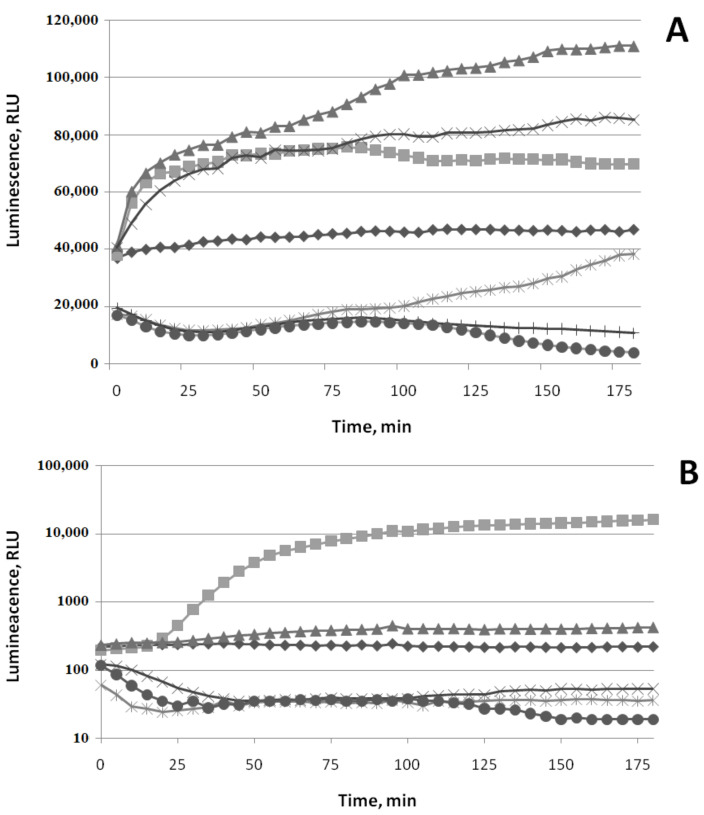
Figure 6.
Luminescent responses of strains E. coli MG1655 (pFabA’::lux) to Triton X-100 and (−)-limonene (A) and E. coli MG1655 (pMerR’::lux) to HgCl2 and (−)-limonene (B). Kinetics of changes in mean values of light emission (in RLU) at various chemical concentrations: (A): (◆) Control (0 μM); TritonX-100 (◼) 0.5 μg/mL, (▲) 2 μg/mL, and (×) 4 μg/mL; (−)-limonene (🞶) 2 μM, (+) 4 μM, and (⬤) 10 μM. (B): (◆) Control (0 μM); HgCl2(▲) 0.001 μM and (◼) 0.3 μM; (−)-limonene (×) 2 μM, (🞶) 4 μM, and (⬤) 10 μM.

