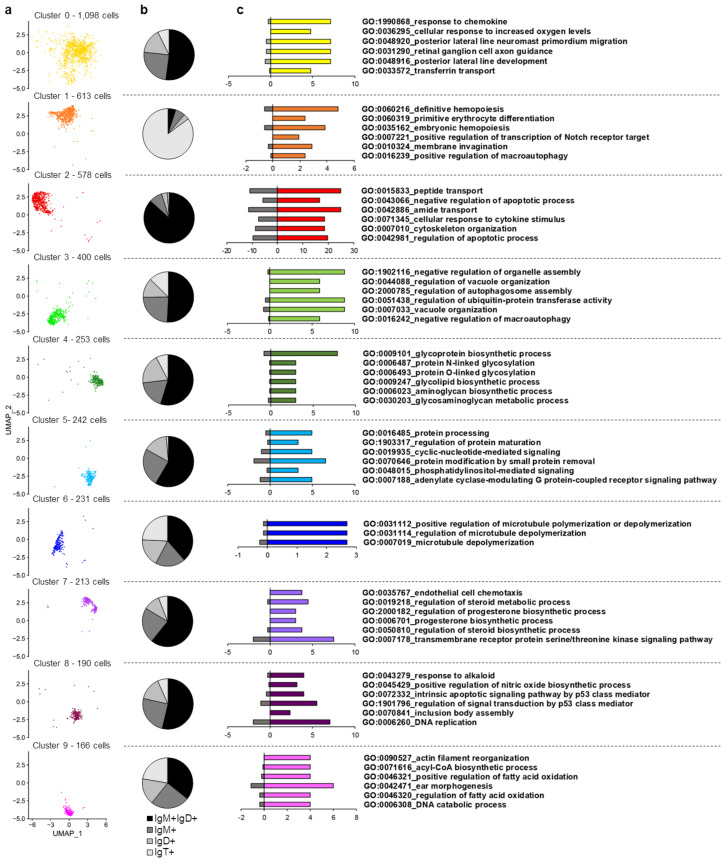
Figure 3.
Cluster definition including immunoglobulin profile of cells and functional analysis of marker transcripts. (a) UMAP visualization of cells in each cluster. (b) Percentage of cells within each cluster assigned to common heavy chain Ig subsets (IgM+IgD+, IgM+, IgD+ and IgT+) according to their transcriptional analysis. (c) Single enrichment analysis along the different cell clusters. Graphs show the percentage of genes within the most significant GO terms at level six within the biological process category for each specific cluster (colored bars) versus the percentage of genes from this category found in the rest of clusters (grey bars).

