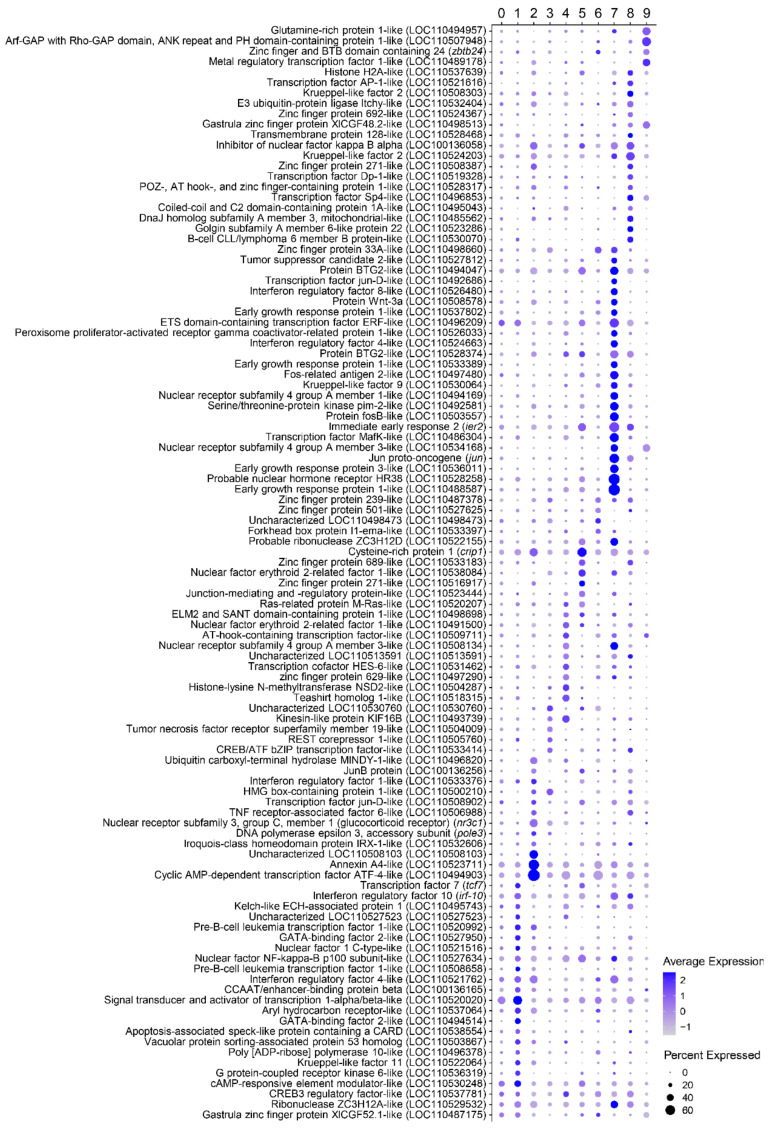
Figure 5.
Dot plot analysis including those marker transcripts identified for each cell cluster related to the activity of transcription factors. For each gene, the average normalized expression (dot color) together with the percentage of cells expressing the gene (dot size) are shown for each cluster.

