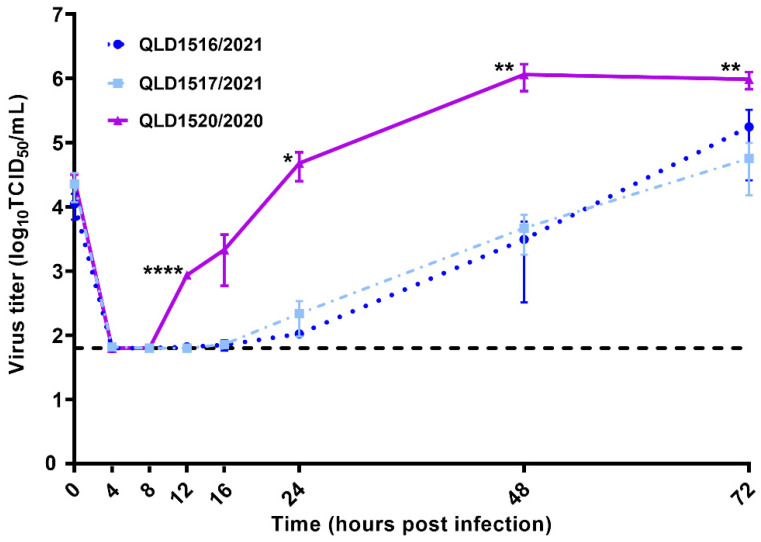
Figure 4.
Kinetic replication curves (mean ± SD) of SARS-CoV-2 VOCs following infection of Vero E6 cells at a m.o.i. of 0.01. The black dotted horizontal line indicates the limit of detection (1.8 Log10 TCID50/mL) of the TCID50 assay. The virus titers at each time point were compared using one-way ANOVA and Tukey post-test. All comparisons between the two B.1.1.7 VOCs, QLD1517/2021 and QLD1516/2021, were not significant. Significant differences between QLD1520/2020 and the two B.1.1.7 VOCs are denoted as * p < 0.05, ** p < 0.01, and **** p < 0.0001.

