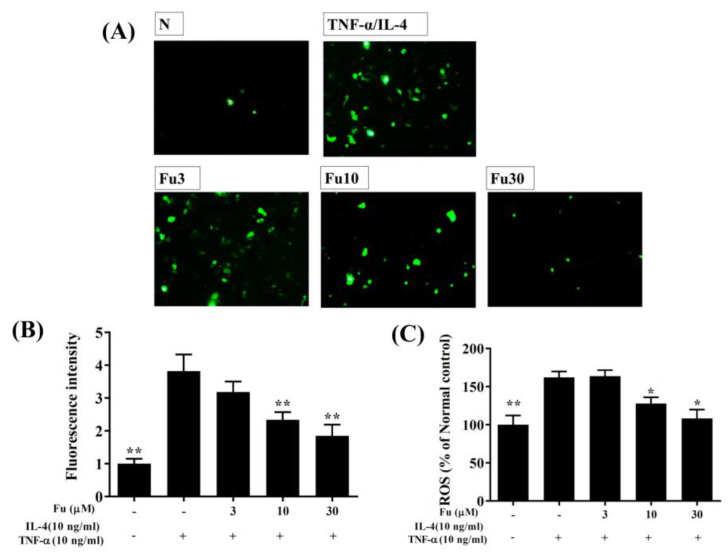
Figure 3.
The effects of fucoxanthin (Fu) on ROS production in activated BEAS-2B cells. (A) Fluorescence microscopy images of intracellular ROS. (B) Fluorescence intensity of intracellular ROS. (C) Percentages of ROS detected in TNF-α/IL-4-activated BEAS-2B cells in the absence or presence of Fu compared to untreated cells (N). Three independent experiments were analyzed. Data are presented as mean ± SEM. * p < 0.05, ** p < 0.01 compared to BEAS-2B cells stimulated with TNF-α and IL-4.

