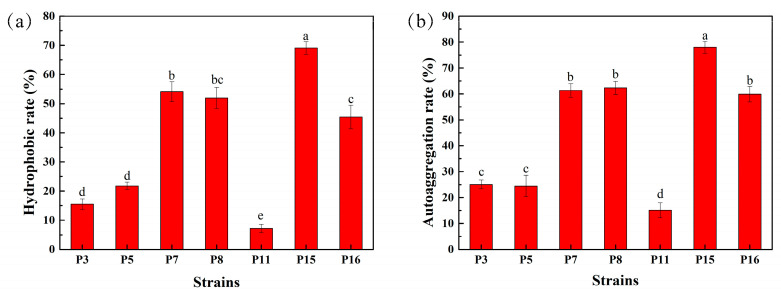
Figure 2.
Cell surface hydrophobicity and auto-aggregation ability of representative LAB isolates. (a) Hydrophobicity (%), (b) auto-aggregation (%). Different lowercase letters (a, b, c, d, e,) denote significant differences (p < 0.05), and results were expressed as mean ± standard deviation (SD) (n = 3).

